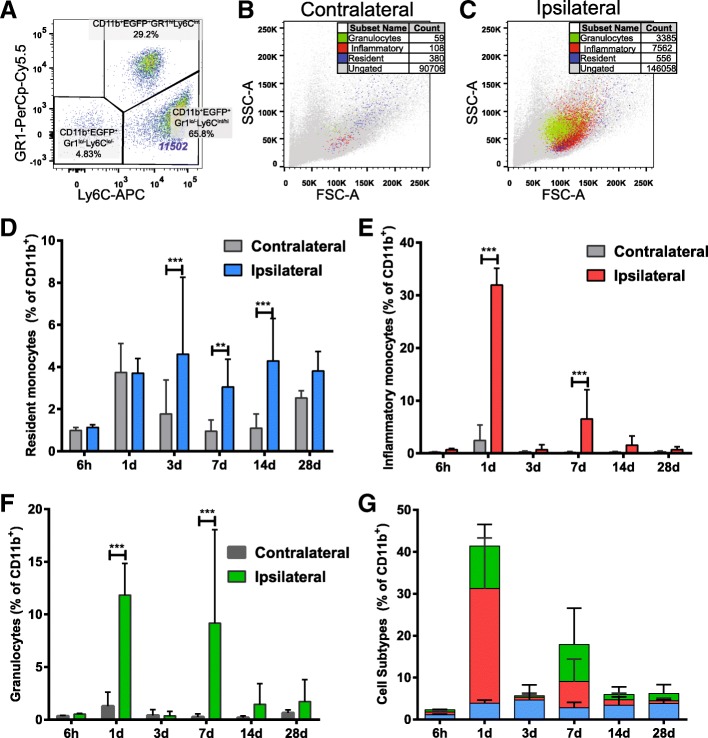
Fig. 4.
Characterisation of EGFP+ cells in the brain after hypoxia-ischemia. EGFP+ myeloid cells were identified after hypoxia-ischemia (HI) through the gating strategy presented in Fig. 1a–c. a EGFP+ were further characterised based on expression of Gr1 and Ly6C and defined as resident monocytes (CD11b+EGFP+Gr1lo/−Ly6Clo/−), inflammatory monocytes (CD11b+EGFP+Gr1lo/−Ly6Cint/hi) and granulocytes (CD11b+EGFP+Gr1hiLy6Cint). b, c Backgating displays the presence of these cell populations in contralateral (b) and ipsilateral (c) hemispheres at 1 day after HI. d–f Compiled data demonstrate these cell subtypes in ipsilateral and contralateral hemispheres at 6 h (n = 8), 1 day (n = 7), 3 days (n = 23), 7 days (n = 19), 14 days (n = 14) and 28 days (n = 9) after HI. g Stacked bar graph showing the relative contribution of each cell population to the total EGFP+ population at each time point. Values are presented as the mean ± SD. One-way ANOVA followed by Holm-Sidak’s post hoc test comparing differences between hemispheres at each time point, **p ≤ 0.01, ***p ≤ 0.001

