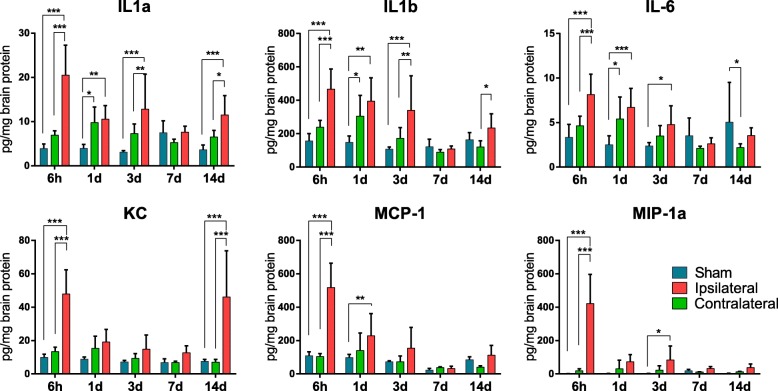
Fig. 5.
Temporal characterisation of CNS chemo- and cytokine regulation following hypoxia-ischemia. Inflammatory responses in brain tissue were investigated using multiplex analysis at 6 h, 1 day, 3 days, 7 days and 14 days after neonatal hypoxia-ischemia. Values are pg/mg (picogram cytokine per milligram brain protein) and presented as the mean ± SD. One-way ANOVA followed by Holm-Sidak’s post hoc test for comparing the differences between sham-operated mice (blue bar) and contralateral (green bar) and ipsilateral (red bar) hemispheres at each time point. n = 5 for sham group and n = 8 for HI groups for each time point. *p ≤ 0.05, **p ≤ 0.01, ***p ≤ 0.001

