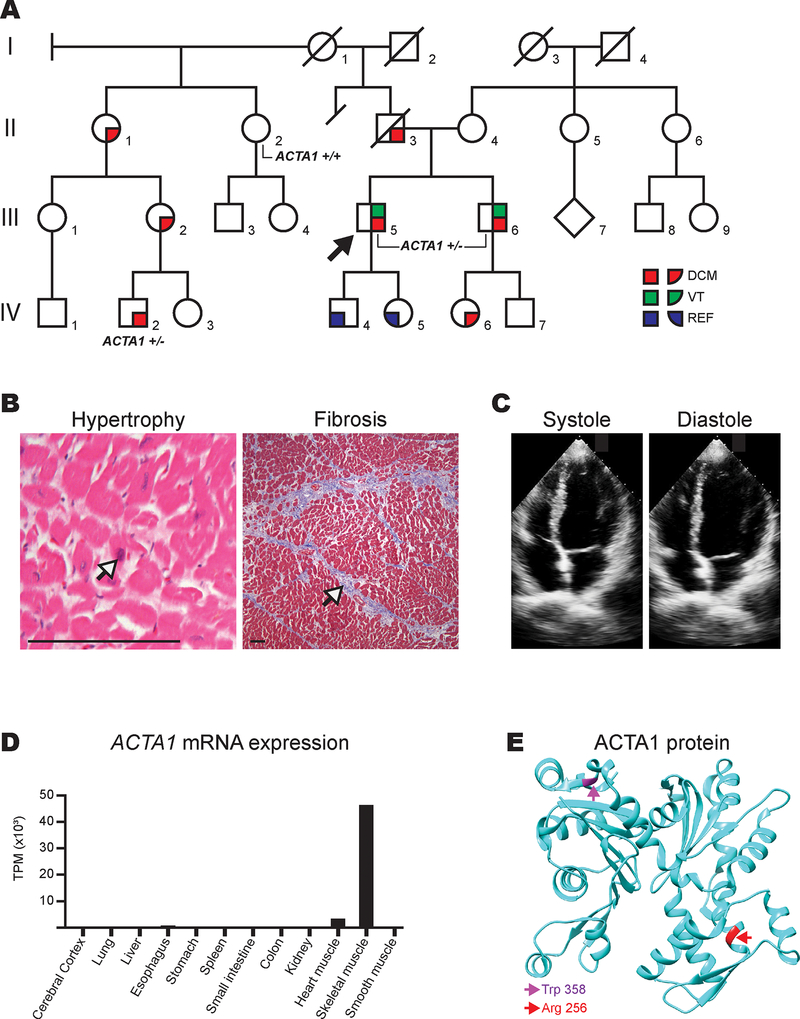
Figure 1A.
Pedigree of ACTA1 p.Arg256His family. Squares and circles represent males and females, respectively, while the diamond represents unknown gender. Generations are labeled by Roman numerals while individuals are labeled with Arabic numerals. Slashes denote deceased family members. The proband, III-5, is denoted with an arrow. III-5, III-6, and IV-2 were confirmed variant carriers and are thus labeled “ACTA1 +/−”. II-2 was confirmed to not have the variant and is thus labeled “ACTA1 +/+”. Red coloring denotes individuals with dilated cardiomyopathy (DCM). Green denotes individuals who experienced ventricular tachycardia (VT). Blue denotes individuals with reduced ejection fraction (REF). B. Explanted heart histology showing hematoxylin and eosin stain (left) demonstrating well-preserved myocytes with box cart nuclei (denoted by arrow) consistent with cardiac hypertrophy and trichrome stain (right) showing mild interstitial fibrosis (denoted by arrow). Scale bar (bottom left) represents 75 μm. C. Apical 4-chamber views (systole and diastole) of the proband’s brother’s (III-6) initial transthoracic echocardiogram at our institution. Left ventricle was normal in size but calculated LVEF was 34%. D. ACTA1 expression in multiple human tissues using data from the Human Protein Atlas (HPA; www.proteinatlas.org) from the “HPA dataset” located at https://www.proteinatlas.org/ENSG00000143632-ACTA1/tissue. Several non-expressing tissues were excluded for figure simplicity: thyroid gland, parathyroid gland, adrenal gland, appendix, bone marrow, lymph node, tonsil, gallbladder, pancreas, salivary gland, duodenum, rectum, urinary bladder, testis, prostate, epididymis, seminal vesicle, fallopian tube, breast, cervix, endometrium, ovary, adipose tissue, and skin. “TPM” denotes “transcripts per million”. E. ACTA1 protein showing the spatial relationship of p.Arg256His (R256H; colored red and with red arrow) compared to previously reported dilated cardiomyopathy-associated variant, p.Trp358C (W358C; colored magenta and with magenta arrow). Graphic generated using UCSF Chimera package and the Protein Data Bank 1J6Z atomic coordinate file.1

