
Figure 2.
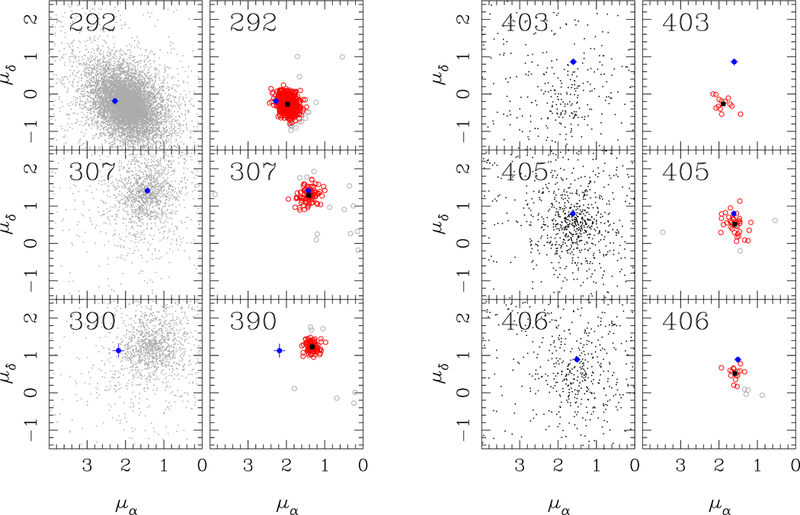
Proper-motion diagram in the field of each star (as labeled). The left panels show the stars selected using the Gaia DR2 CMD plus parallax criterion (gray symbols), while the right panels show the stars selected using the 2MASS CMD plus parallax criterion (gray circles). The red symbols in the right panels highlight the stars selected to determine the mean proper motion within each field. The black filled square shows each mean; its uncertainty is smaller than the symbol size. The blue symbols show the proper motion of each of our young blue stars.