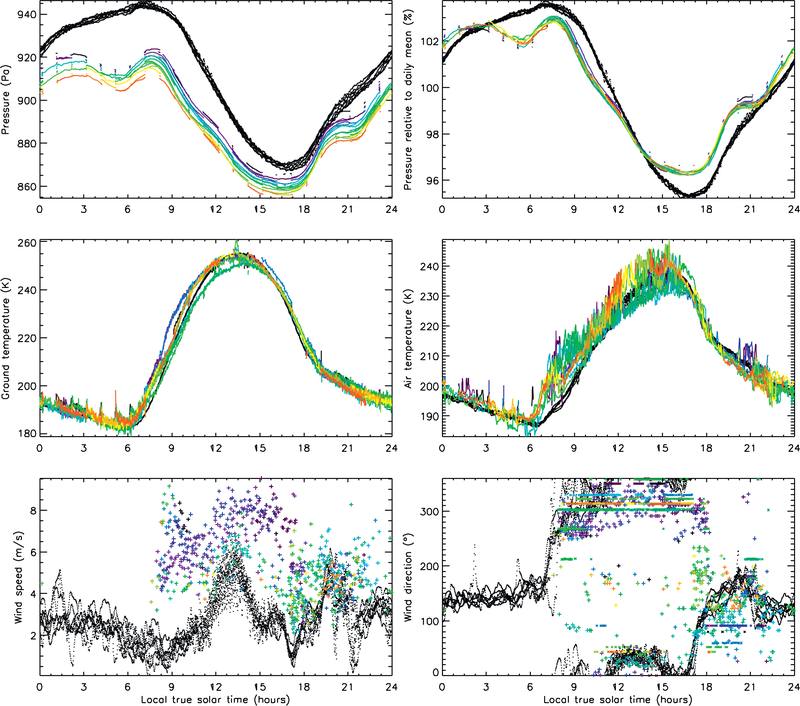
Fig. 15.
Comparison between REMS data (colors indicate different sols, from purple [sol 1162] to red [sol 1179]) and MarsWRF domain 6 predictions at the same time and location (black) for all sols during the Wind Characterization Campaign. The top row shows (left) surface pressure in Pa and (right) surface pressure relative to the daily mean in %. The middle row shows (left) ground temperature and (right) air temperature in K. The bottom row shows (left) wind speed in m/s and (right) wind direction (direction from which the wind blows) in ° relative to N (i.e., northerly winds have a direction of 0°, westerlies a direction of 270°, etc.). Rear wind directions are plotted as the midpoint of the quadrant from which the wind blows, and appear as horizontal lines. This is because the two quadrant midpoints are +/− 135° relative to the rover heading, hence are constant while the rover is parked in one heading. (For interpretation of the references to color in this figure legend, the reader is referred to the web version of this article.)

