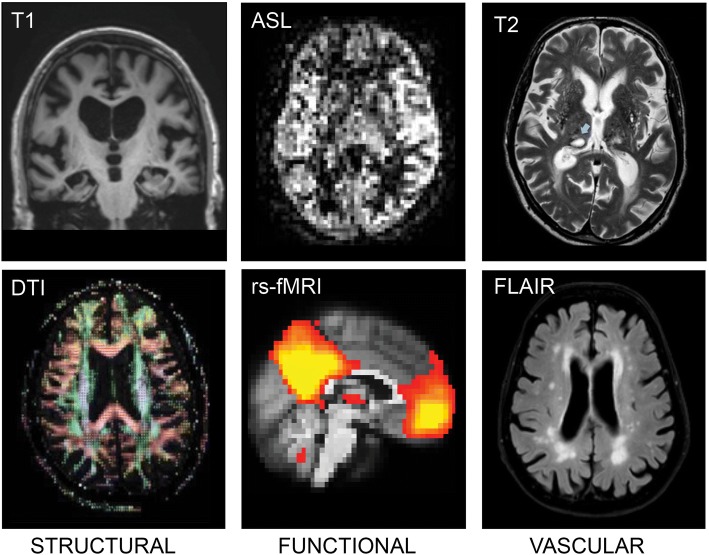
Fig. 2.
MRI imaging biomarkers. Left: T1-weighted MRI (top) showing severe hippocampal atrophy and example of diffusion tensor imaging (DTI) (bottom). Middle: example of functional imaging markers with arterial spin labelling (ASL) (top) and resting state functional magnetic resonance imaging (rs-fMRI) (bottom). Right: imaging of vascular pathology with thalamus lacune on T2 (top; arrow) and white matter hyper-intensities on fluid attenuated inversion recovery (FLAIR) (bottom)

