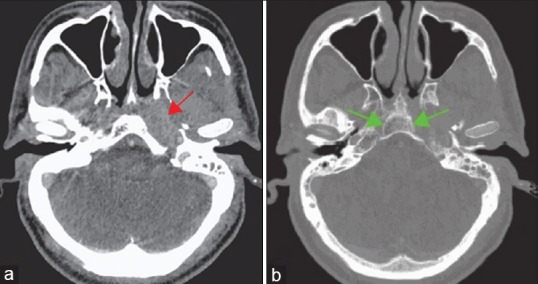
Figure 2.

Axial computed tomography images following intravenous contrast administration (a) Soft-tissue window settings demonstrate the fullness of the posterior nasal space and posterior nasopharynx with abnormal soft tissue along the course of the Eustachian tube (red arrow). (b) Bone window settings demonstrate opacification of mastoid air cells on the left with erosive bone loss involving the inferior petrous bone. Loss of clarity of the cortical outline of the basisphenoid (green arrows) and the proximity to the carotid vessel can be noted
