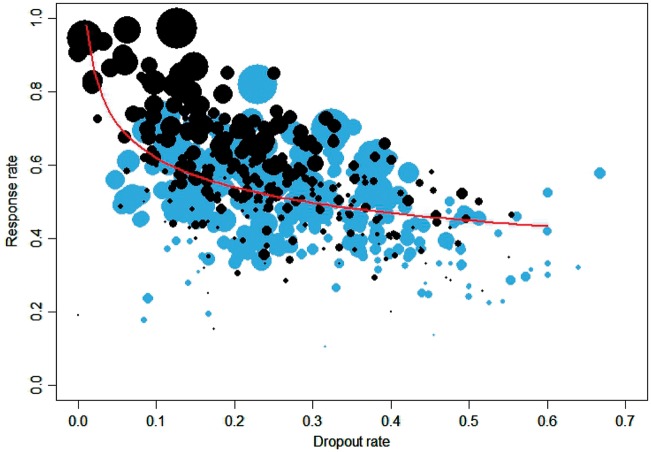
Figure 2.
Response rate in active arms versus dropout rate due to any cause. Data in grey are from arms with probability of receiving placebo π > 0% and data in black are from arms with probability of receiving placebo π = 0%. The line corresponds to the multivariate regression line (exponentiated).

