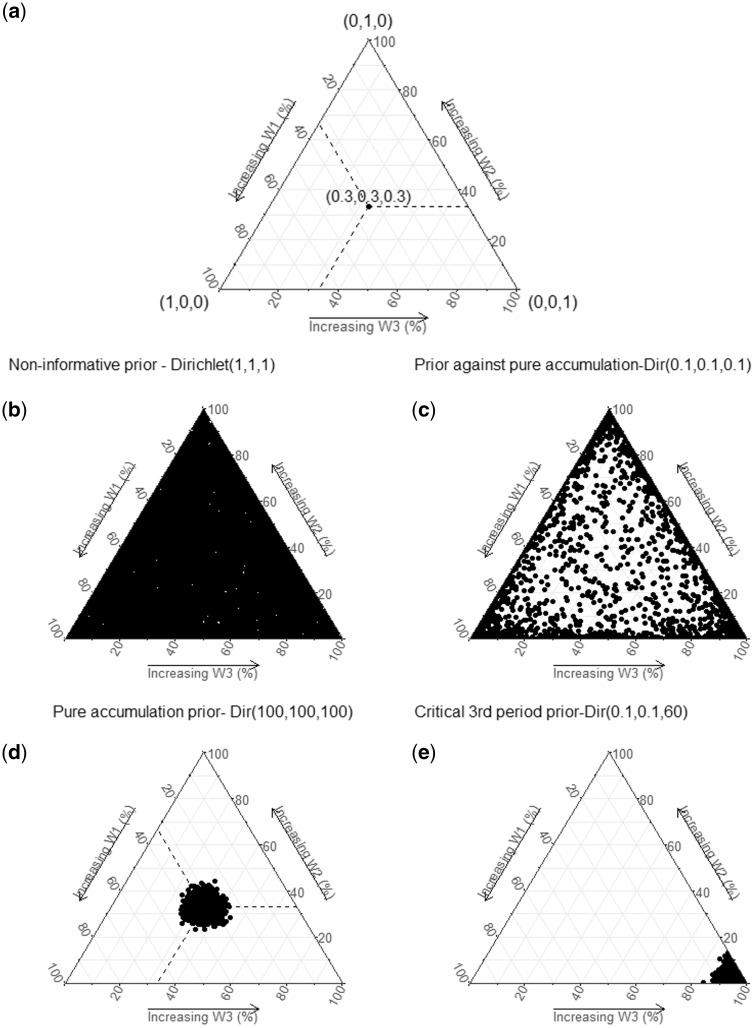
Figure 2.
Examples of multivariate priors for weights in Bayesian relevant life course exposure models. 2(a). The three sides of the triangle plots represent three weights in percentage, one for each life period considered. The vertices represent corresponding extreme weights [(1, 0, 0), (0, 1, 0), (0, 0, 1)] and the midpoint of the plot represents equal weights (0.33, 0.33, 0.33). The concentration of dots represents the density of the corresponding Dirichlet distribution at that point. 2(b) illustrates equal distribution of density (equal probability for any combination of weights). 2(c) illustrates higher probabilities at the vertices compared with midpoint (favours critical period compared with accumulation hypothesis). 2(d) illustrates higher probabilities at the midpoint, favouring a pure accumulation hypothesis (w1 = w2 = w3). 2(e) illustrates higher probability at one vertex (favouring critical period at one vertex; w1 = 0, w2 = 0, w3 = 1).

