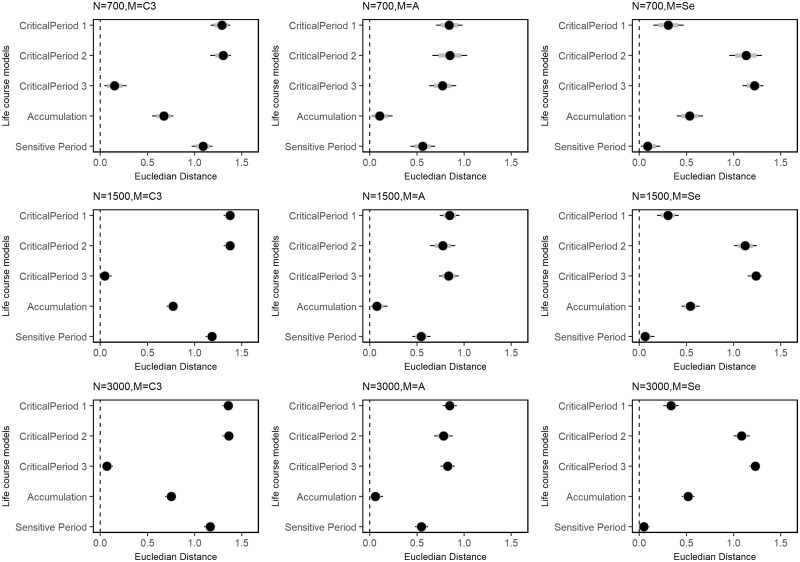
Figure 4.
Means and 95% credible intervals of posterior distributions of Euclidean distances under three life course scenarios and sample sizes. Columns represent the life course scenario under which data were simulated and rows represent different sample sizes. The Y-axis of each plot shows the following reference vectors to estimated weights: CP-1 (w1 = 1, w2 = 0, w3 = 0); CP-2 (w1 = 0, w2 = 1, w3 = 0); CP-3 (w1 = 0, w2 = 0, w3 = 1); A (w1 = w2 = w3 = 0.3333); SP (w1 = 0.75, w2 = 2.0, w3 = 0.05).

