
Figure 4.
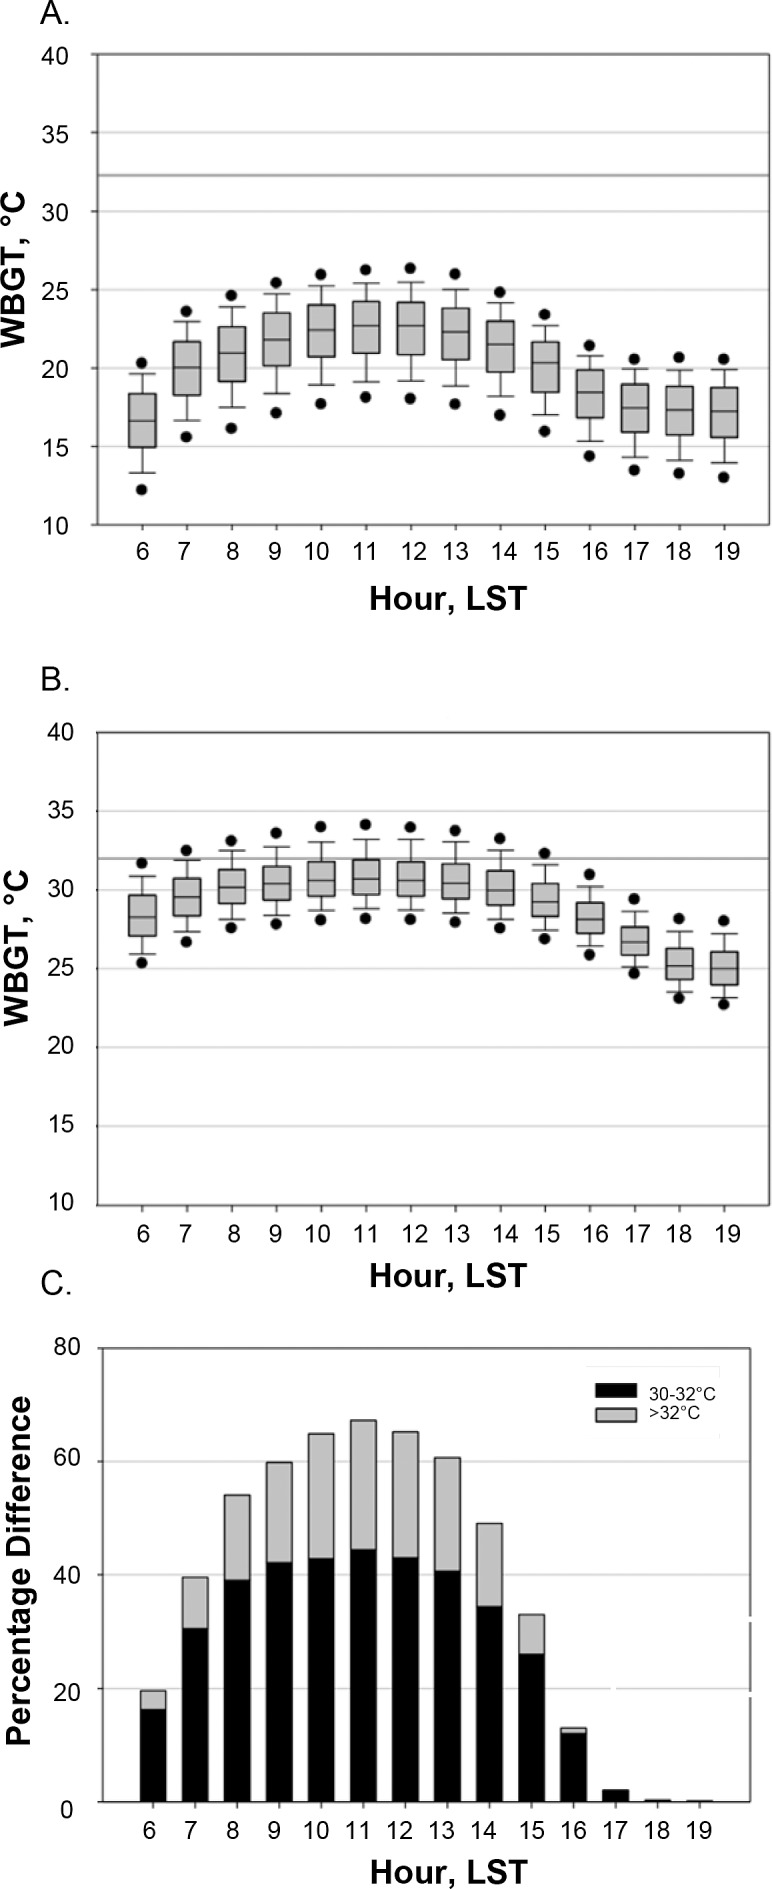
Box plots of hourly wet-bulb globe temperatures (WBGTs) from 1980–2016 in Qatar during (A) the scheduled (November 21–December 18) and (B) traditional (June 14–July 15) periods of international football tournaments, and (C) difference in the percentage of hours at 30°C–32°C and >32°C WBGT in Qatar between the traditional summer and the scheduled fall tournament time. The boundaries of the box represents the 25th and 75th percentiles. The line within the box indicates the median, the whiskers are the 10th and 90th percentiles, and the points above and below the whiskers are the 5th and 95th percentiles, respectively. The horizontal line marks 32°C WBGT. Abbreviation: LST, Local Standard Time.