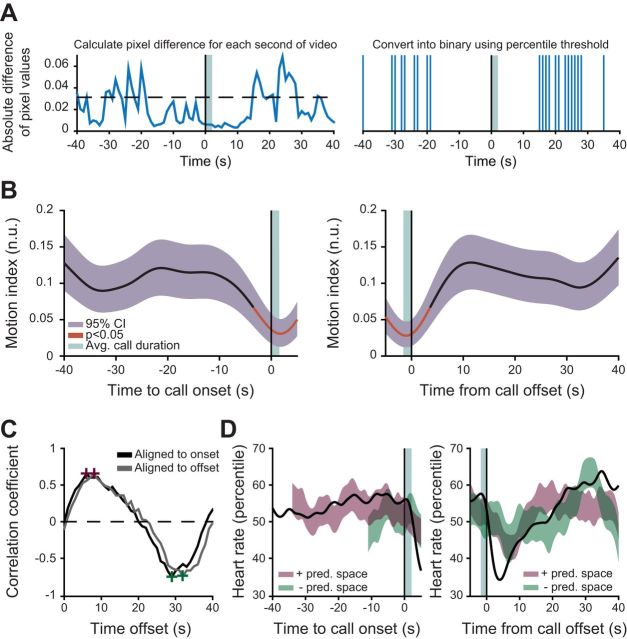
Fig. 4.
General motor activity partially accounts for fluctuations in arousal during a vocalization. A: schematic showing how we calculate the motion index for each animal. B: smoothed population median of ongoing motor activity plotted with the 95% bootstrapped CI of the median. Red line indicates values outside 95% of the bootstrapped significance test for motor variability. C: cross-correlation plot of the motion and heart rate signals for data aligned to call onset (black) and call offset (gray). The positive (purple) and negative (green) peaks of the cross correlation are denoted with crosses and were used to construct a linear predictor. D: results of a linear predictor of heart rate from ongoing motor activity. The smoothed population median of heart rate is plotted (black) against the 95% bootstrapped CI of the motion-predicted heart rate at its positive (purple) and negative (green) peak.

