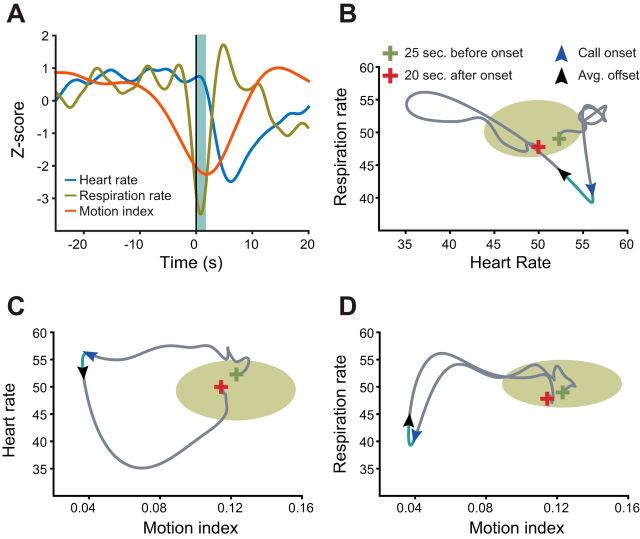
Fig. 6.
Vocalizations are produced when perturbations of the system take the cardiorespiratory dynamics away from an attractor state. A: Z-scored signals for heart rate (blue), respiration rate (gold), and motor activity (red) from 40 s before call onset until 20 s after call onset. Shaded region indicates the average duration of a call. B–D: state spaces for the median cardiorespiratory activity reported in Fig. 3, A and B (B), cardiomotor activity reported in Figs. 3A and 4B (C), and respiratory motor activity reported in Figs. 3B and 4B (D). Each graph represents median activity from 25 s before call onset until 20 s after call onset. The circular region outlines the 95% confidence intervals for multivariate normal Gaussian distribution of the bootstrapped significance test for the relevant data from Figs. 3A, 3B, and 4B. Green and red crosses denote the beginning and end of the trajectory, respectively, whereas the blue and black arrows signify call onset and the average call offset, respectively. The direction of the arrow indicates the dynamic's direction, and the light blue line between the arrows delineates the call event.

