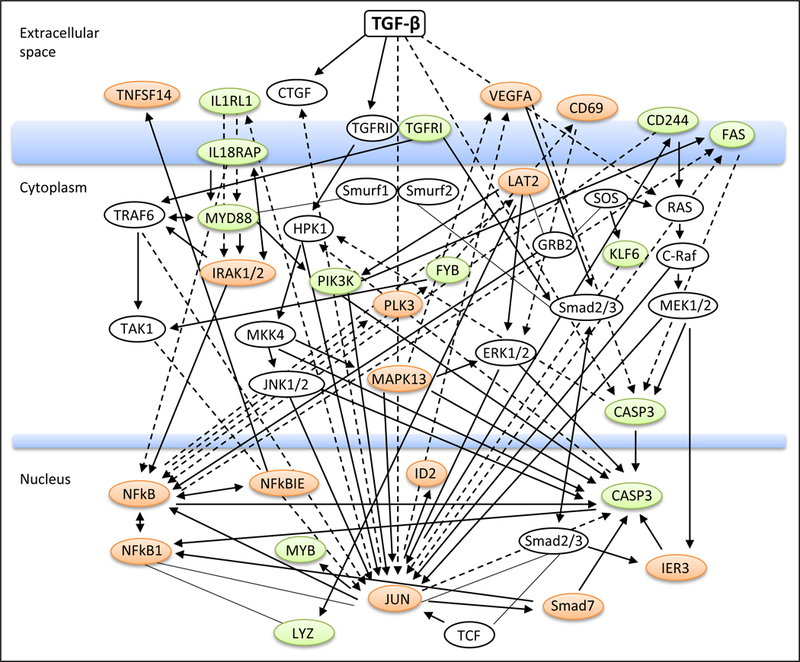
Figure 2. Analysis of pathways responsible for the expression of TGF-β target genes.

The annotated interactions and regulatory relationships were generated using IPA’s (Ingenuity Pathway Analysis) connectivity analysis. Hub genes (in white circles) were defined as those regulating or interacting with ≥5 TGF-β targeted transcripts. Representative genes immediately downstream of hub genes are shown (orange, upregulated; green, downregulated).
