
FIGURE 6.
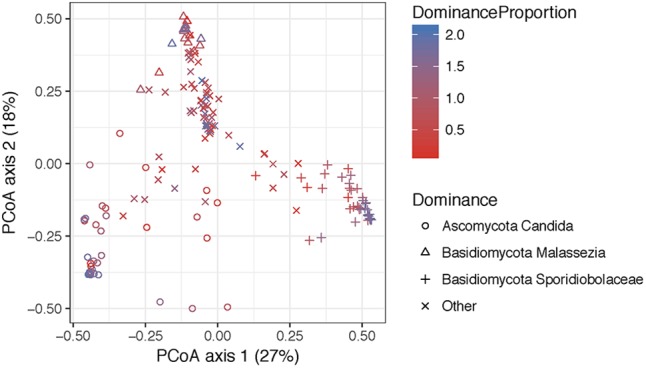
Principal coordinate analyses visualization of pairwise Bray–Curtis distance matrixes of the introitus samples according to most dominant fungal taxa. Points are colored with respect to dominance. Statistical tests for variation in group centroid position reveal significant differences in all three dominant taxa Candida, Malassezia, and Sporidiolobaceae (P = 0.001) (see Supplementary Table 5).