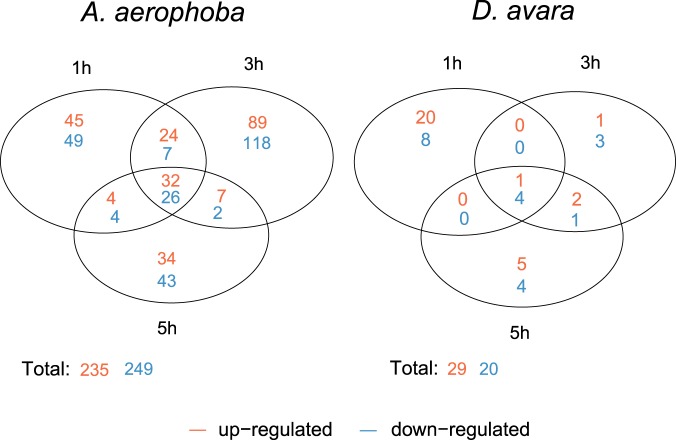
Figure 1.
Numbers of DEGs those were either common or specific for each time point (1 h, 3 h, 5 h) in each sponge species upon MAMP treatment. Within each time point, DEGs were identified by comparing gene expression levels in MAMP relative to control treatment and according to the defined threshold FDR p-value < 0.005 and log2|FC| ≥ 2 expression, as calculated in edgeR. “Up-regulated” and “down-regulated” refers to genes with higher and lower expression in MAMP than in control treatment, respectively.

