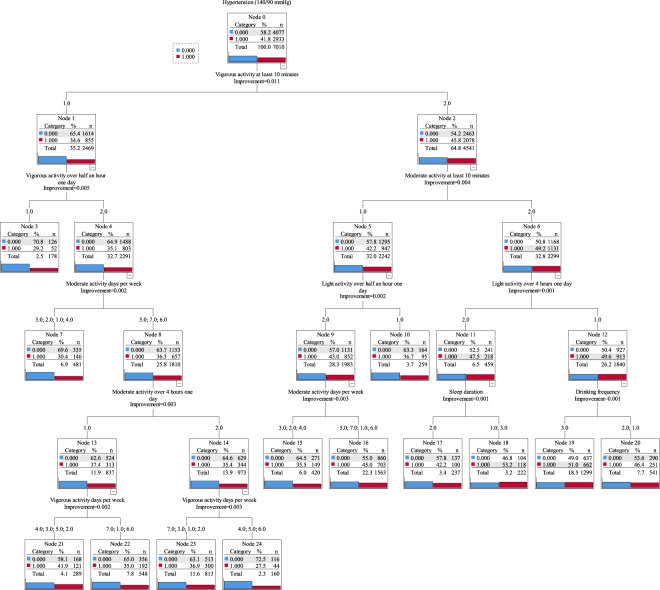
Figure 2.
The structure of the decision tree model. Red categories indicate the prevalence of hypertension and blue categories indicate the prevalence of no hypertension. Vigorous/moderate/light activity at least 10 minutes, vigorous/moderate/light activity over half an hour/2 hours/4 hours one day (1: Yes, 2: No); Sleep duration (1: <7 hours, 2: 7–10 hours, 3: ≥10 hours); Drinking frequency (1: Never, 2: <1/month 3: >1/month); Residence (1: Main city zone, 2: Other, 3: Village); Gender (1: Male, 2: Female); Smoking status (1: Ever or current, 2: Never). Hypertension was defined as systolic BP ≥ 140 mm Hg, or diastolic BP ≥ 90 mm Hg, or self-reported use of antihypertensive medications (old definition) in this diagram.

