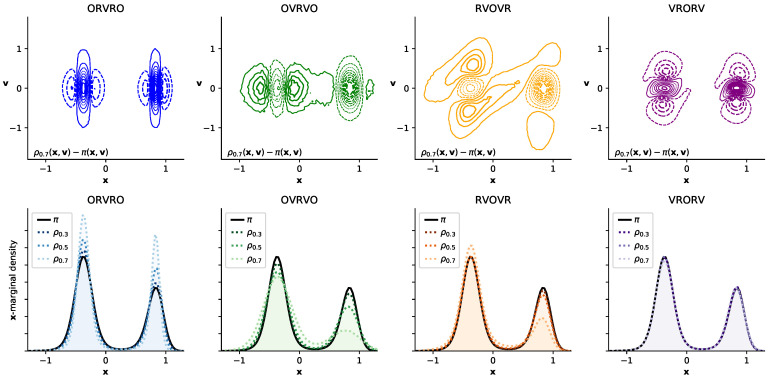
Figure 1.
Different numerical integrators introduce different error structure in phase space, illustrated in a double-well system. Here, we illustrate the timestep-dependent discretization error introduced by four integrators on a 1D double-well potential []. The top row of 2D contour plots illustrates the difference between the phase-space density sampled at the maximum timestep considered (, close to the stability limit) and the equilibrium density ; solid lines indicate positive contours, while dashed lines indicate negative contours. The bottom row of 1D density plots shows timestep-dependent perturbation in the sampled marginal distribution in configuration space, , with the equilibrium distribution depicted as a solid black line. The sampled marginal distributions are shown for increasingly large timestep, denoted , depicted by increasingly light dotted lines, for (arbitrary units). Inspecting the contour plots suggests that some integrator splittings (especially VRORV) induce error that fortuitously “cancels out” when the density is marginalized by integrating over , while the error in other integrator splittings (ORVRO, OVRVO) constructively sums to amplify the error in configuration space.

