Fig. 1.
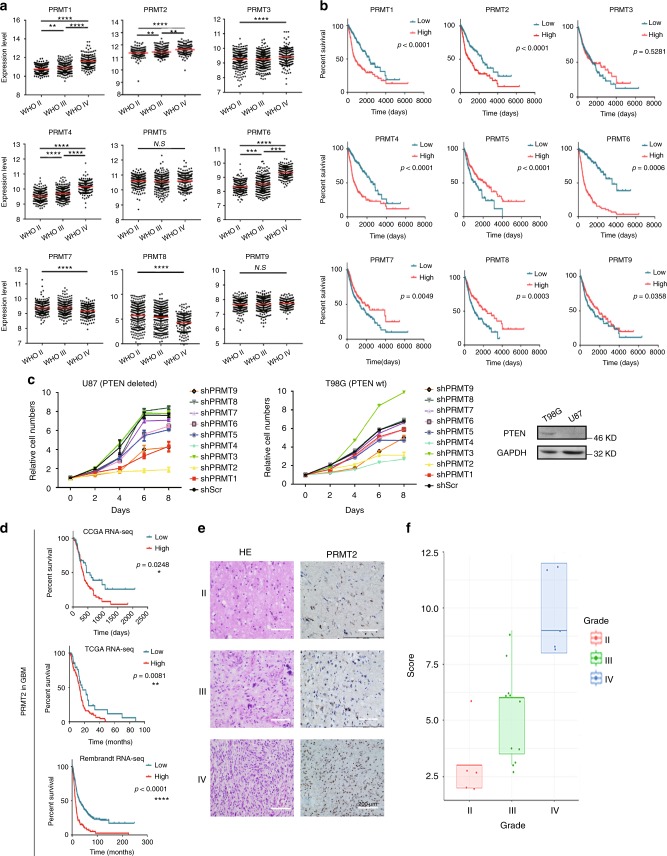
PRMT2 expression is elevated in glioblastoma and associated with adverse prognosis. a The mRNA levels of PRMT family members were analyzed in different grades of gliomas according to the TCGA datasets. Significance level was determined using one-way ANOVA followed by Dunnett’s multiple comparisons test. *p ≤ 0.05, **p ≤ 0.01, ***p ≤ 0.001, and ****p ≤ 0.001. b Kaplan–Meier survival curves for correlation between mRNA expression of each PRMT family member and survival of glioma patients in the TCGA dataset. c Cell growth curves of two GBM cells expressing the indicated shRNAs. MTS assay was employed at the specified time points to follow the rate of proliferation. The error bars denote SD, n = 3. WB analysis validates the differential PTEN expression status. GAPDH serves as a loading control. d Kaplan–Meier survival curves for correlation between PRMT2 mRNA expression and survival of GBM patients in the TCGA RNA-seq dataset, CGGA RNA-seq dataset, or Rembrandt RNA-seq dataset. e Representative examples from IHC analysis of PRMT2 protein levels in different grade of glioma specimens are shown. Scale bar, 200 µm. f Correlation between PRMT2 protein levels and malignant degree of gliomas. Tumor sections from 21 glioma specimens were IHC-stained with anti-PRMT2 antibody. Lines within boxes indicate medians of the scores

