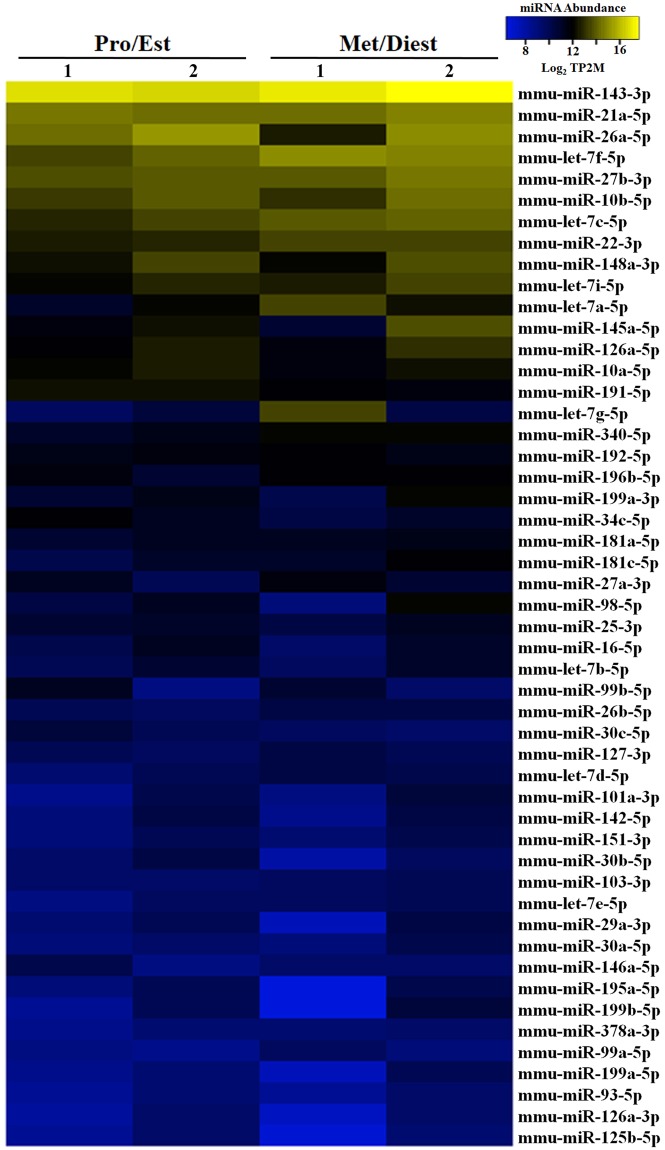
Figure 2.
Heat map with hierarchal clustering analysis of the top 50 most abundant miRNAs in purified OVS from females in Pro/Est and Met/Diest. Analysis was performed on data from two biological replicates of each sample. Yellow shading represents miRNA abundance higher than 10 transcripts per two million (10TP2M), and blue shading represents miRNA abundance between 6 and 10 TP2M. MiRNA abundance in Pro/Est and Met/Diest is consistent between samples for 88% of the miRNAs.

