Figure 3.
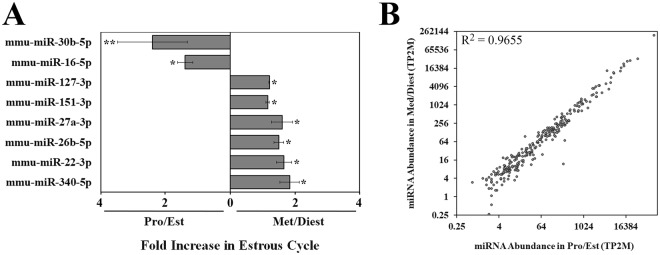
Generally, miRNA expression levels in OVS are similar in Pro/Est and Met/Diest samples. (A) Eight miRNAs in the top 50 are present in different abundances in Pro/Est and Met/Diest samples. Six (12%) miRNAs are significantly more abundant in Met/Diest, and 2 (4%) miRNAs are significantly more abundant in Pro/Est, with a fold change ≥ 1.5. (*P < 0.05, **P < 0.01). (B) MiRNA abundance is correlated between Pro/Est and Met/Diest samples. Data are from 272 miRNAs with abundances of at least 2TP2M in both biological replicates of either Pro/Est or Met/Diest samples. Data shown are from Biorep 2 (R2 = 0.9655). Biorep 1 (not presented) shows a similar pattern with R2 = 0.9486.

