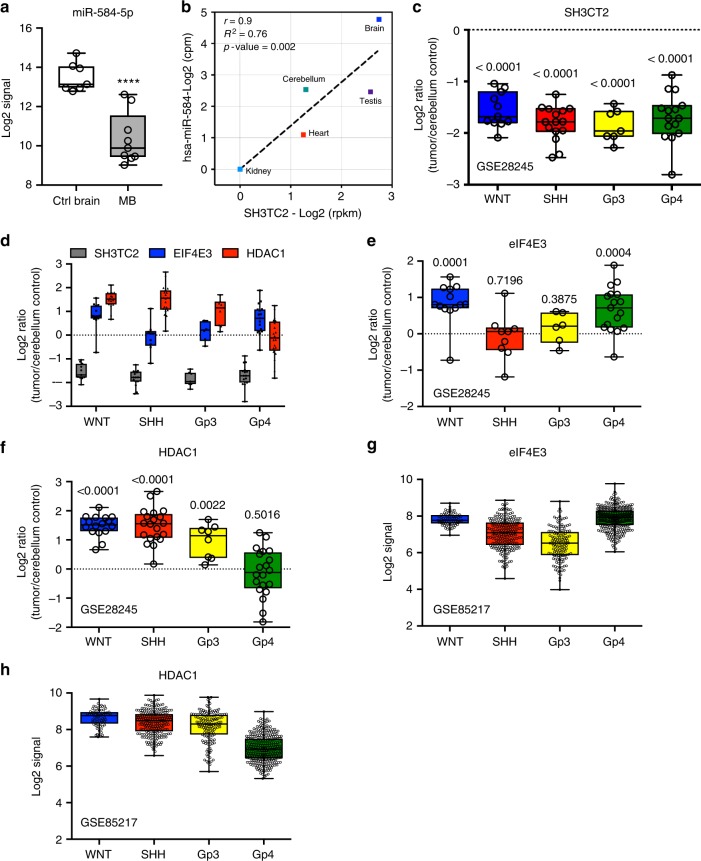
Fig. 10.
Lower miR-584-5p expression parallels with higher eIF4E3/HDAC1 levels in MB. a Meta-analysis of GSE42657 data set showing miR-584-5p expression levels in human MB samples and control cerebellum. Data represent Log2 ratio of tumor/cerebellum. b Meta-analysis of miRIAD: intragenic microRNA database showing correlation between miR-584-5p expression and the expression of its host gene SH3TC2. c Meta-analysis of GSE28245 data set showing SH3TC2 expression levels in different sub-types of MB samples (WNT: n = 16; SHH: n = 20; Gp3: n = 20; Gp4: n = 20) and control cerebellum. Data represent Log2 ratio of tumor/cerebellum control. p-values are calculated using the Wilcoxon-signed rank test (theoretical median = zero). d Meta-analysis of GSE28245 data set showing SH3TC2, eIF4E3, and HDAC1 expression levels in different sub-types of MB. Data represent Log2 ratio of tumor/cerebellum control. e, f Meta-analysis of GSE28245 data set showing eIF4E3 (e) and HDAC1 (f) expression levels in different sub-types of MB. Data represent Log2 ratio tumor/cerebellum control. p-values are calculated using the Wilcoxon-signed rank test (theoretical median = zero). g, h Meta-analysis of GSE85217 data set showing eIF4E3 (g) and HDAC1 (h) expression levels in different sub-types of medulloblastoma. Data represent Log2 ratio of tumor/cerebellum control (WNT: n = 763; SHH: n = 223; Gp3: n = 144; Gp4: n = 326. Whiskers in the box plots represent minimum to maximum value. The center line in the box represents the median value. Black open circles in the box represent individual MB patient tumor sample. ****p < 0.0001; ***p < 0.001; **p < 0.01

