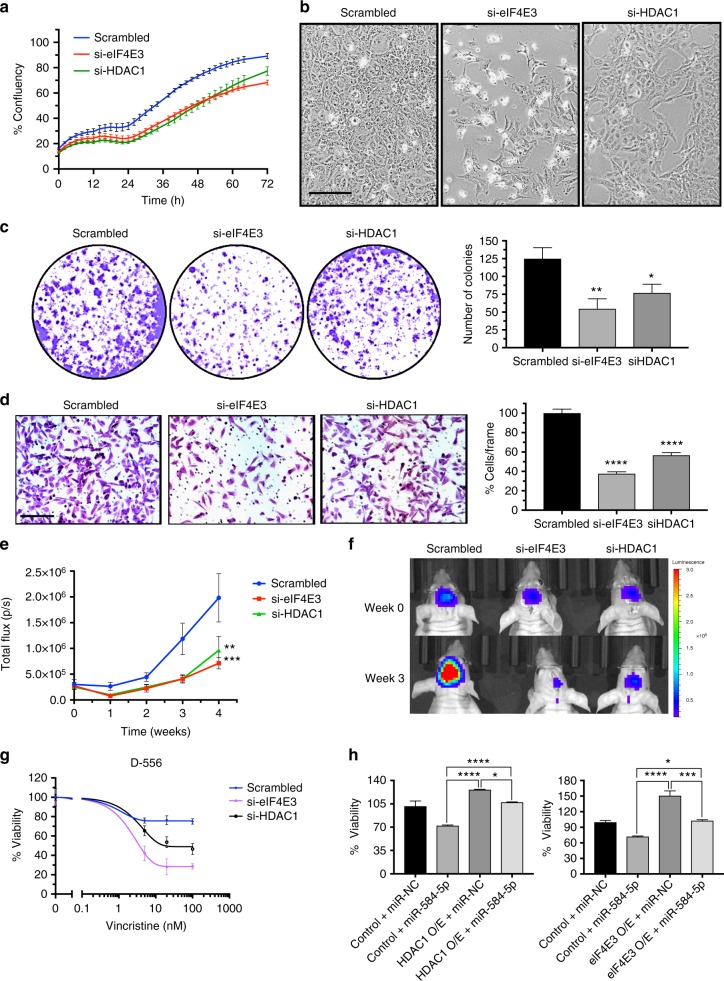
Fig. 5.
eIF4E3 and HDAC1 promote MB growth and inhibit VCR sensitivity of MB cells. a Proliferation of D556Med cell transfected with scrambled- or eIF4E3/HDAC1-siRNA. Cell proliferation was measured using an IncuCyte phase-only processing module. The p-values were determined by the sum-of-squares F test. Error bars represent mean ± SEM of three independent experiments. b Difference in morphology between D556Med cells transfected with scrambled-siRNA, eIF4E3-siRNA, or HDAC1-siRNA. c Colony-forming assay of D556Med cells transfected with scrambled-siRNA, eIF4E3-siRNA, or HDAC1-siRNA. Bar graph shows crystal violet-stained colonies counted microscopically. The p-value was calculated using a standard Student t-test. Error bars represent mean ± SEM of three independent experiments (performed in triplicate/experiment). d Photomicrograph showing migrated D556Med cells transfected with scrambled-siRNA, eIF4E3-siRNA, or HDAC1-siRNA. Bar graph shows number of migrated cells microscopically counted in ten different fields. The p-value was calculated using a standard Student t-test. Error bars represent mean ± SEM of three independent experiments. e Line graphs show mean tumor volume in nude mice intracranially injected with DAOY–GFP–luciferase cells transfected with scrambled-siRNA or eIF4E3/HDAC1-siRNA (n = 6 mice/group). The p-values were determined by the sum-of-squares F test. Error bars represent mean ± SEM. f Live bioluminescence (BLI) images of mice injected with DAOY–GFP–luciferase cells transfected with scrambled-siRNA or eIF4E3/HDAC1-siRNA (n = 6 mice/group). g VCR dose–response curve of D556Med cells transfected with scrambled-siRNA, eIF4E3-siRNA or HDAC1-siRNA and treated with VCR or vehicle. Cell viability was assessed using alamarBlue cell viability assay. The p-values were determined by the sum-of-squares F test. Error bars represent mean ± SEM of three independent experiments (performed in sixtuplicate/experiment). h miR-584-5p rescues cancer growth-promoting effects of eIF4E3 and HDAC1. Bar graphs showing viability of D556Med cells transfected with control plasmid or eIF4E3/HDAC1 expression vector or cotransfected with eIF4E3/HDAC1 expression vector and miR-584-5p mimic. The p-value was calculated using one-way analysis of variance (ANOVA) followed by Sidak’s multiple-comparisons test. Error bars represent mean ± SEM of three independent experiments (performed in sixtuplicate/experiment). ****p < 0.0001; ***p < 0.001; **p < 0.01. Scale bars: 50 μM (b, d)

