Fig. 6.
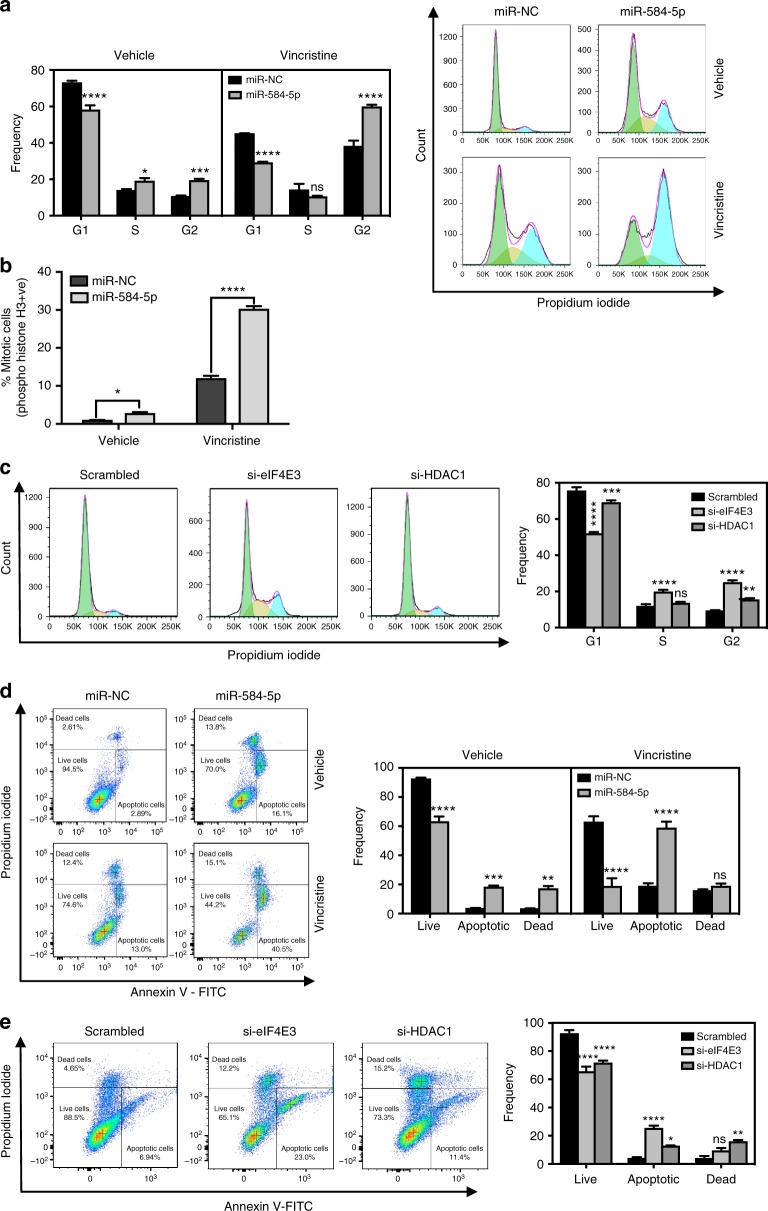
MiR-584-5p–HDAC1/eIF4E3 signaling regulates cell cycle progression of MB cells. a Bar graphs show quantification of DNA histograms (using FlowJo software) reflecting cell cycle progression in D556Med cells transfected with miR-NC or miR-584-5p and treated with vehicle or vincristine (VCR). DNA histograms were obtained from FACS analysis of cells treated with miR-NC or miR-584-5p and treated with vehicle or vincristine (VCR). Error bars represent mean ± SEM of three independent experiments. b Bar graphs show FACS analysis of Histone H3 pSer10-positive D-556 cells transfected with miR-NC or miR-584-5p and treated with vehicle or VCR. The p-values were calculated using standard Student t-tests. Error bars represent mean ± SEM of three independent experiments. c FACS analysis of cell cycle progression in D556Med cells transfected with scrambled-siRNA or eIF4E3-siRNA or HDAC1-siRNA. Bar graphs reflect DNA histograms quantified using the FlowJo software. Error bars represent mean ± SEM of three independent experiments. d FACS analysis of Annexin V–FITC-positive cells in D556Med cells transfected with miR-NC or miR-584-5p and treated with vehicle or VCR. Bar graphs show dot plots quantified using the FlowJo software. Error bars represent mean ± SEM of three independent experiments. e FACS analysis of Annexin V–FITC-positive cells in D556Med cells transfected with scrambled-siRNA or eIF4E3-siRNA or HDAC1-siRNA. Bar graphs show dot plots quantified using the FlowJo software. Error bars represent mean ± SEM of three independent experiments. The p-values for d–e were determined by two-way ANOVA followed by Tukey’s multiple-comparisons test. ****p < 0.0001; ***p < 0.001; **p < 0.01; *p < 0.05

