Fig. 9.
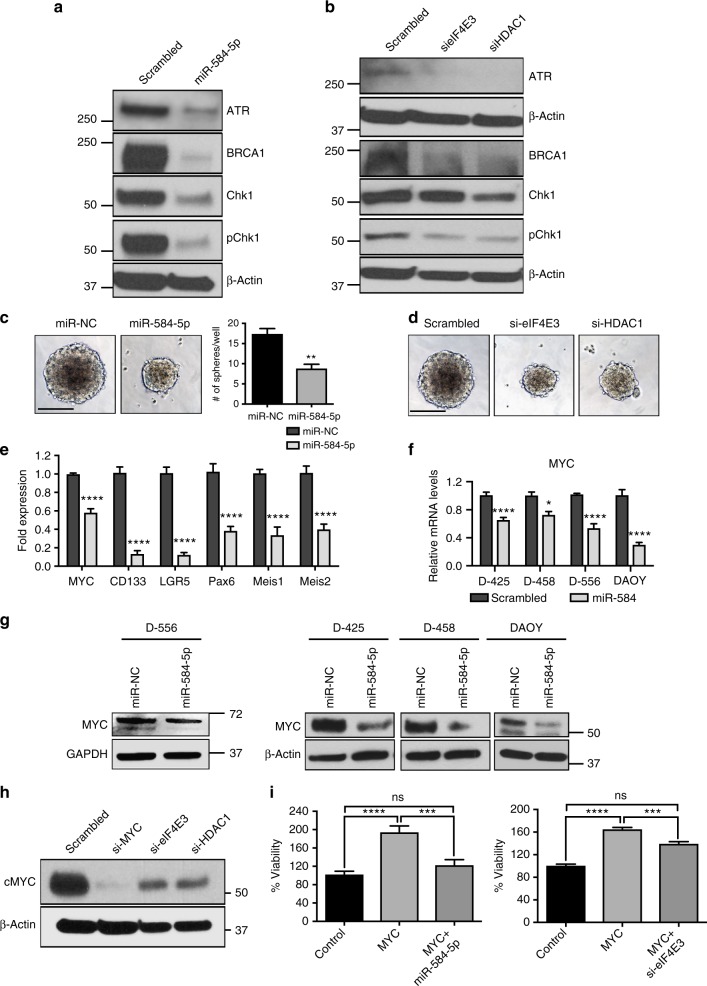
MiR-584-5p–eIF4E3/HDAC1 regulates c-MYC and MB stem cell proliferation. a, b Western blot analysis of DAOY cells treated with miR-NC or miR-584-5p mimic (a) or scrambled or eIF4E3/HDAC1-siRNA (b) using antibodies against indicated proteins. Gel pictures are representative of three independent experiments. c Medullospheres grown from D556Med cells transfected with miR-NC or miR-584-5p mimic. Bar graphs show number of medullospheres obtained from D556Med cells transfected with miR-NC or miR-584-5p mimic. The p-value was calculated using a standard Student t-test. Error bars represent mean ± SEM of three independent experiments (performed in triplicate for each experiment). d Medullospheres grown from D556Med cells transfected with scrambled-siRNA or eIF4E3/HDAC1-siRNAs. e qPCR analysis of stem cell markers in D556Med cells transfected with miR-NC or miR-584-5p mimic. The p-value was calculated using one-way ANOVA followed by Sidak’s multiple-comparisons test. Error bars represent mean ± SEM of three independent experiments (performed in triplicate for each experiment). f qPCR analysis of MYC expression in D556Med, D425Med, D458Med, and DAOY cell lines. The p-values were calculated using standard Student t-tests. Error bars represent mean ± SEM of three independent experiments (performed in triplicate for each experiment). g Western blot analysis of c-Myc in D556Med, DAOY, D425Med, and D458Med cells transfected with miR-NC or miR-584-5p mimic. h Western blot analysis of MYC in D556Med cells transfected with siRNA against scrambled, eIF4E3, HDAC1, or c-Myc. Gel pictures in g and h are representative of three independent experiments. i miR-584-5p and eIF4E3 rescue c-Myc-dependent MB cell growth. Bar graphs show percentage of cell viability in control vector, c-Myc expression vector, or miR-584-5p mimic plus c-Myc expression vector or eIF4E3-siRNA plus c-Myc expression vector-transfected D556Med cells. Cell viability was assessed using alamarBlue. The p-value was calculated using one-way ANOVA followed by Sidak’s multiple-comparisons test. Error bars represent mean ± SEM of three independent experiments (performed in sixtuplicate for each experiment). ****p < 0.0001; ***p < 0.001; **p < 0.01; *p < 0.05. Scale bars: 100 μM (c, d)

