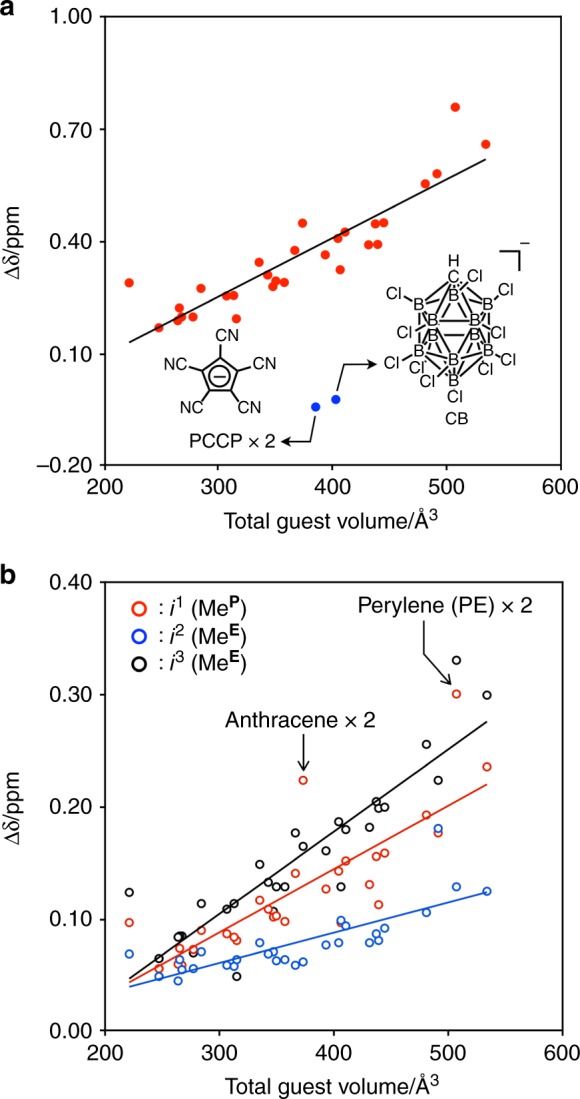
Fig. 3.

Chemical shift change of the p-tolyl methyl signals. a Plots of total chemical shift changes of the p-tolyl methyl signals (the sum of chemical shift changes of the three p-tolyl methyl signals) upon the encapsulation of guest molecules. Red and blue solid circles indicate neutral and anionic guests, respectively. b Plots of chemical shift change of each p-tolyl methyl signal (i1, i2, and i3) upon the encapsulation of neutral guest molecules. The guest molecules tested are summarized in Supplementary Table 1
