
Figure 1.
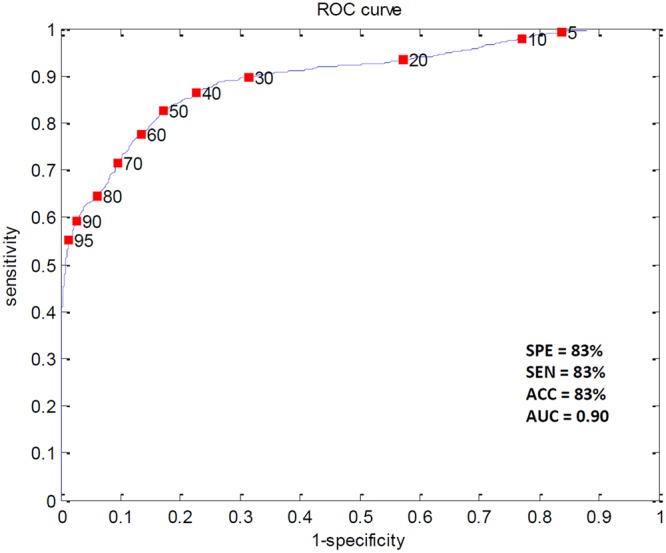
The ROC curve for the HD vs. control Index estimated with repeated 10-fold cross-validation along with the result. SPE = specificity; SEN = sensitivity; ACC = accuracy; AUC = area under the curve.
Official websites use .gov
A
.gov website belongs to an official
government organization in the United States.
Secure .gov websites use HTTPS
A lock (
) or https:// means you've safely
connected to the .gov website. Share sensitive
information only on official, secure websites.
The ROC curve for the HD vs. control Index estimated with repeated 10-fold cross-validation along with the result. SPE = specificity; SEN = sensitivity; ACC = accuracy; AUC = area under the curve.