
Figure 1.
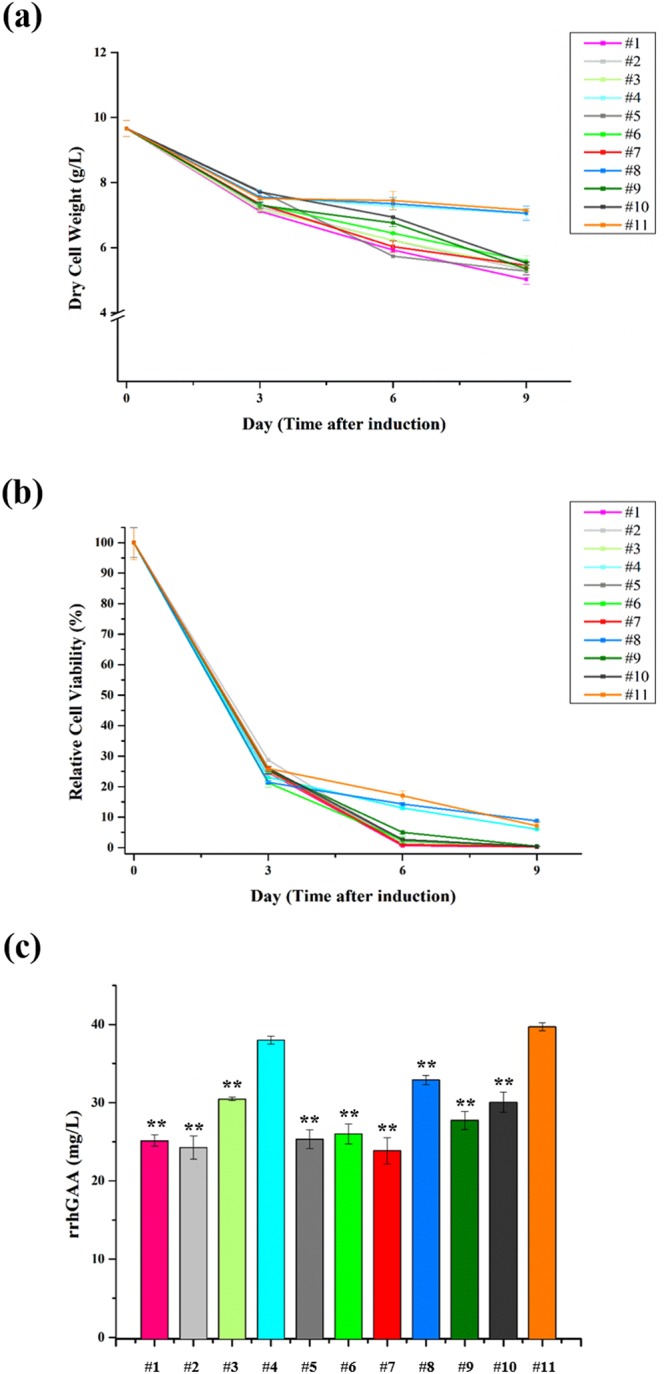
Effects of mannosidase inhibitors on (a) cell mass, (b) relative cell viability, and (c) rrhGAA production on day 9 in rice cell cultures. Cultures were performed in triplicates, and each cell mass and relative cell viability were determined every 3 days after inoculation. Values are represented as the mean ± SD. On day 9, the amounts of rrhGAA in culture media were measured using indirect ELISA. Asterisks indicate the statistical significance (one-way ANOVA) compared to control without mannosidase inhibitors at level **p < 0.01. The coded values of the mannosidase inhibitors are represented in Table 1.