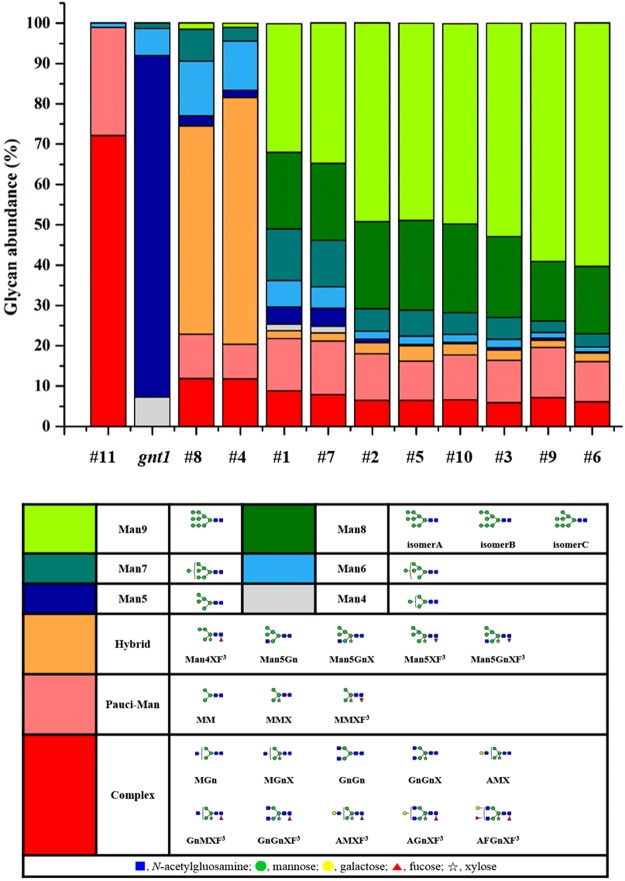
Figure 4.
Relative glycan abundance according to the design of experiment using KIF and/or SWA compared to the control culture (#11: wild type rice cells; gnt1: gnt1 knock-out rice cells) without mannosidase inhibitors. Relative glycan abundance of rrhGAA was analyzed by UPLC chromatography after purification. Mean values of glycan abundance (%) are shown (n = 3). Different shades of colors represent percentages of each glycovariants, and the corresponding structures of N-glycans are indicated below the table.

