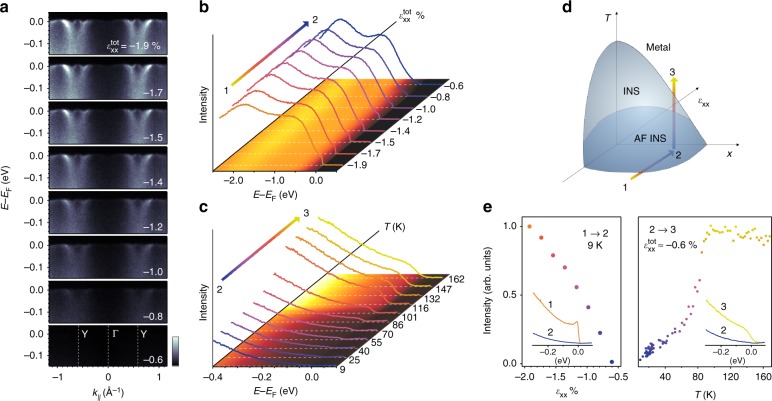
Fig. 3.
Strain tuning of the MIT. a Evolution of the quasiparticle band structure of Ca2−xPrxRuO4 for x = 0.07 along YΓY at 8 K as the strain is tuned along the path 1 → 2 in the schematic phase diagram shown in d. The data were acquired using 64 eV photons with linear horizontal polarization. Light colors correspond to high intensities. b Angle-integrated energy distribution curves (EDCs) over the full width of the occupied Ru t2g states as a function of uniaxial strain. c Angle-integrated EDCs as a function of temperature measured at minimum strain (path 2 → 3). The sample undergoes the MIT at ~90 K. e Evolution of the spectral weight at the Fermi level along the path 1 → 2 → 3 defined in d

