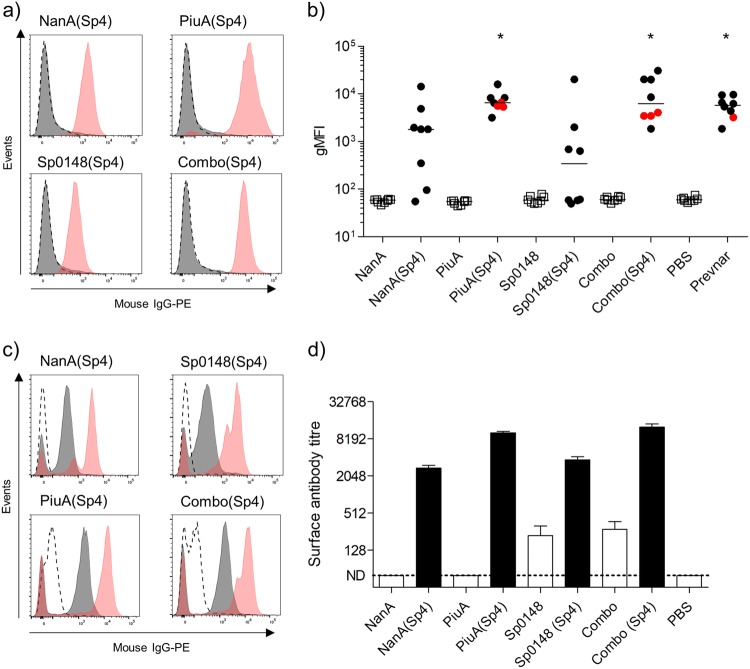
Fig. 3.
Flow cytometry analysis of antibody deposition on streptococcal species. a Representative histograms for antibody deposition on S. mitis(SpT4) in 10% antiserum from glycosylated (red shading) and unglycosylated (grey shading) vaccine groups. PBS vaccinated serum (dashed line) was included as a control. b Antibody deposition measured using a flow cytometry assay on S. mitis(SpT4) in 10% murine antiserum (n = 8) from glycosylated (closed circles) and unglycosylated (open squares) vaccine groups. Red dots indicate reactions containing reduced antiserum concentrations (5 vs 10%) in high titre samples. *p < 0.05 Kruskal–Wallis with Dunn’s post-test (vs PBS). c Examples of flow cytometry histograms for antibody deposition on the TIGR4 S. pneumoniae strain in 2% (red shading), 0.2% (grey shading), and 0.02% (dashed line) antiserum from glycosylated vaccine groups. d Antibody deposition on TIGR4 in pooled antiserum from mice vaccinated with glycosylated or unglycosylated vaccines. Deposition titres were determined using bacteria incubated with decreasing concentrations of Prevnar-13 antiserum to generate a standard curve. Results displayed as mean ± SEM from technical replicates

