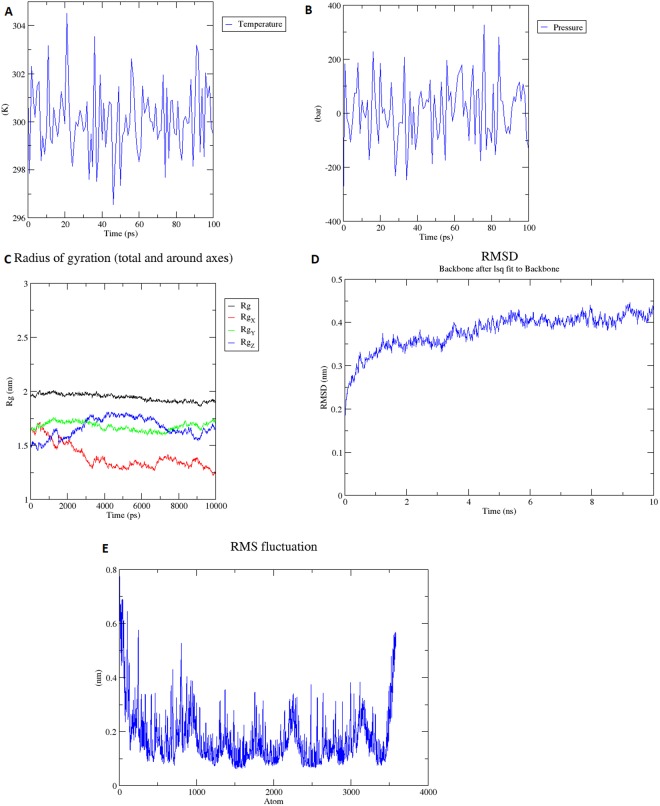
Figure 4.
Molecular dynamics simulation of the vaccine candidate (A) Temperature; system temperature reached to 300 K and stay constant around 300 K (100 ps) (B) Pressure; Ligand pressure plot at equilibration phase of 100 ps. (C) Rg plot; vaccine construct is stable in its compact form during the simulation time (D) RMSD; RMSD levels off to ~0.45 which represents the stability of vaccine construct (E) RMSF; RMSF-Root Mean Square Fluctuation plot, peaks shows the regions with high flexibility.

