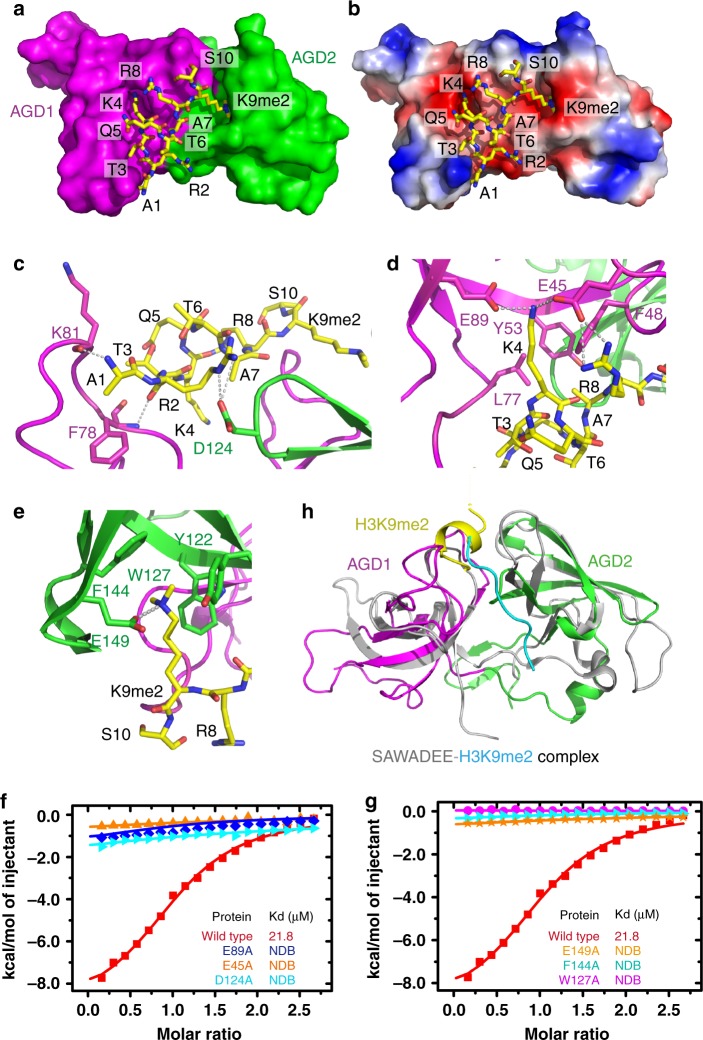
Fig. 2.
Interactions between the H3K9me2 peptide and RsAGDP1 AGD12. a A surface view of the RsAGDP1 AGD12 with AGD1 and AGD2 colored in magenta and green, respectively. The H3K9me2 peptide is shown in stick representation. The side chains of H3K4me0 and H3K9me2 insert into two adjacent surface pockets on AGD1 and AGD2, respectively. b An electrostatics surface view of the RsAGDP1 AGD12 with the H3K9me2 peptide in stick representation. The peptide binds at a large negatively charged surface with H3K4me0 and H3K9me2 inserting into two negatively charged surface pockets, respectively. c-e The detailed recognition of H3A1 and H3R2 (c), H3K4, H3A7, and H3R8 (d), and H3K9me2 (e). The interacting residues and the hydrogen bonds are highlighted in stick and dashed silver lines, respectively. f-g The ITC-binding curves between H3K9me2 and RsAGDP1 AGD12 mutations disrupting the H3R2, H3K4, and H3R8 (f) or the H3K9me2 (g) binding residues show that the mutations of critical residues significantly impair the binding between AGD12 and H3K9me2. h A superimposition of RsAGDP1 AGD12-H3K9me2 complex (in color) and SHH1 SAWADEE-H3K9me2 complex (in silver, PDB code: 4IUT). The H3K9me2 peptide from the SHH1 SAWADEE complex is colored in cyan. The AGDP1 AGD12 and SHH1 SAWADEE generally adopt a similar folding topology with their binding H3K9me2 peptides locating at the shorter and longer edge of the two AGD/tudor domain interface, respectively

