Fig. 6.
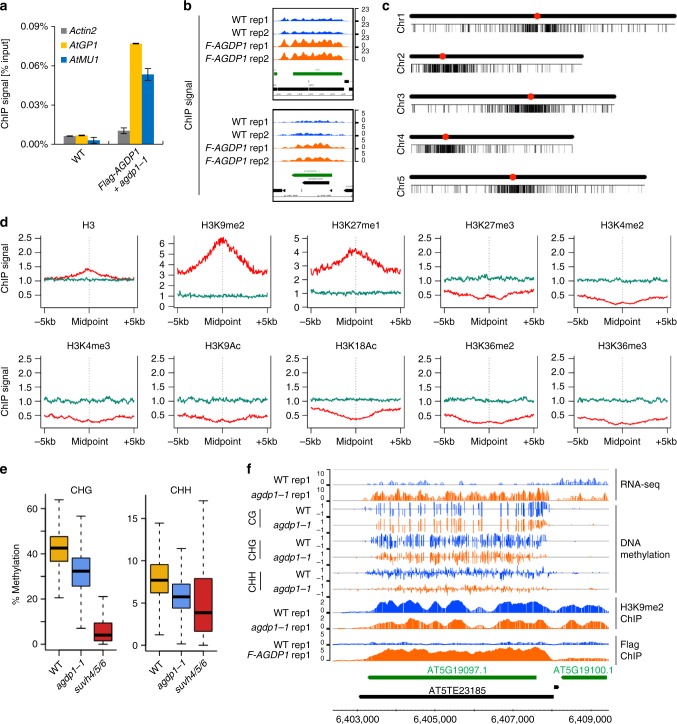
AGDP1 is enriched in heterochromatin. a AGDP1 is enriched at AtGP1 and AtMU1 as determined by ChIP-qPCR. ChIP signals were quantified relative to input DNA. Actin2 was used as a negative control locus. Error bars are SDs of three biological replicates. b ChIP-seq results show that AGDP1 is enriched at AtGP1 (upper) and AtMU1 (lower). Two replicates of ChIP-seq data from Flag-AGDP1 transgenic plants and from wild-type control plants are shown. The y axis is normalized read counts per million. The normalization factor is calculated by the total mapped reads. c The distribution of AGDP1-enriched peaks throughout the five chromosomes. Black bars represent AGDP1 peaks. Red circles indicate centromeres. d Association of different histone modifications at regions surrounding the AGDP1 peaks. Simulation regions (green) served as control regions. e Box plots representing CHG and CHH methylation levels of 1914 AGDP1-binding regions. f RNA expression, DNA methylation, H3K9me2 levels, and AGDP1 enrichment at a representative region. The y axis is normalized read counts per million (ChIP-seq) or ten million (RNA-seq). The normalization factor is calculated by the total mapped reads

