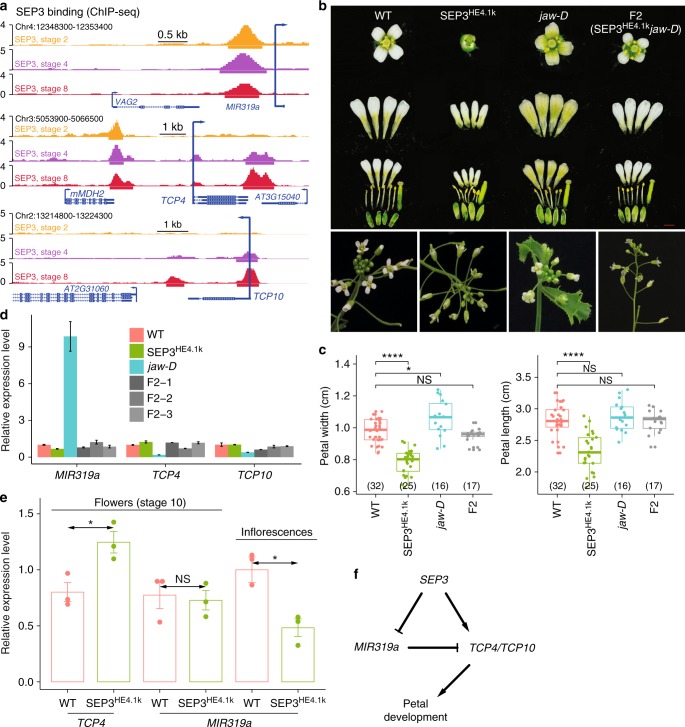
Fig. 4.
SEP3 as a direct regulator of MIR319a. a Dynamics of SEP3 binding at the loci of MIR319a (top), TCP4 (middle), and TCP10 (bottom). Arrows indicate transcriptional directions. b Pictures of single flowers and separated petals as well as other flower organs (top panel; scale bar = 1 mm) and inflorescences (bottom) of wild-type (WT) plants, enhanced expression of SEP3 (SEP3HE4.1k), jaw-D mutant lines, and combination (F2) of jaw-D mutant and SEP3HE4.1k. c Boxplots showing the petal width (left) and petal length (right) of different genotypes in b. The number of biologically independent plants is shown in parentheses. Boxes represent quartiles, center lines denote 50th percentile, and whiskers extend to most extreme values within 1.5× interquartile range (IQR). Significance codes, ****: P-value <0.0001, *: P-value <0.05, and NS: not significant, by two-sided Mann–Whitney tests. Bar = mean ± s.e. d Relative expression of MIR319a, TCP4, and TCP10 in the inflorescences of WT, jaw-D mutant, SEP3HE4.1k lines, and three independent F2 lines produced by crossing jaw-D and SEP3HE4.1k lines. e Relative expression of TCP4 and MIR319a in either whole inflorescences or stage 10-enriched flower tissues of WT and SEP3 enhanced expression lines. For all the expression analysis, data represent mean of three independent biological replicates. The Tip41 gene (AT4G34270) was used as reference. Significance codes as in c. f SEP3-MIR319a-TCP4/TCP10 coherent feed-forward loop in regulation of petal development

