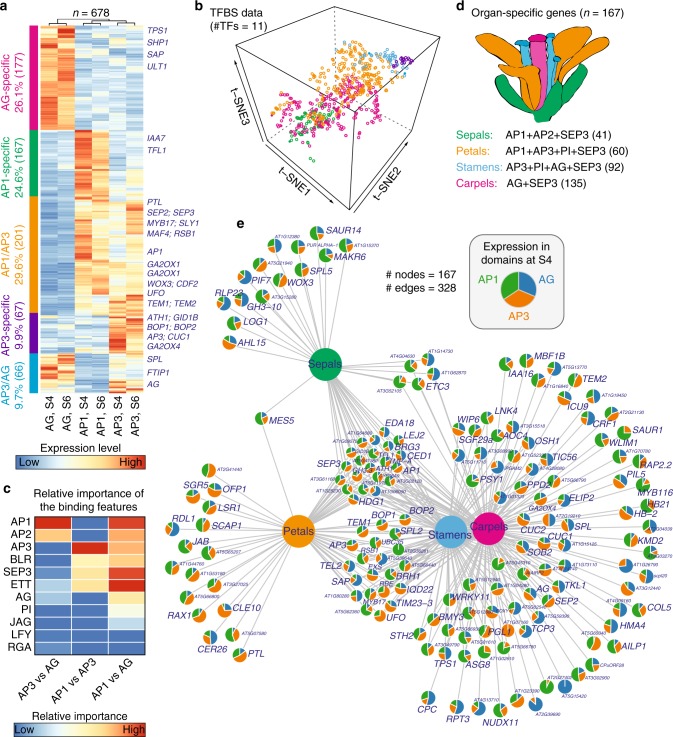
Fig. 5.
Organ-specific gene expression controlled by floral master regulators. a Clustering analysis of domain-specific gene expression. Five major clusters correspond to five distinct spatiotemporal domains (colored in left bars): AP1-, AP3-, AG-specific, “AP1/AP3” (AP1 and AP3-common domains), and “AP3/AG” domains. Dendrograms above the heatmap illustrate the overall similarity of gene expression patterns. Example genes are indicated in the right. Domain expression data at stages 4 (S4) and 6 (S6) were obtained from ref. 62. b 3D t-SNE (t-distributed stochastic neighbor embedding) plot showing the overall similarity of transcription factor (TF)-binding profiles of organ-specific genes. Normalized ChIP-seq intensity for the 11 selected TFs were used in the analysis. c Predicting the contributions of promoter binding by multiple TFs to gene expression difference between two different domains by a Lasso regression model. Regression coefficients are plotted in heatmap as relative importance of the binding features. d Domain-specific genes targeted by floral quartets that determine different floral organ identities, i.e., sepals, petals, stamens, and carpels, as colored in the diagram of floral organs. The number of organ-specific genes is shown in parentheses. e Network showing domain expression patterns of target genes for the four floral homeotic tetrameric MADS TF complexes as indicated in d. Nodes as pie charts show gene expression patterns in AP1, AP3, and AG domains at stage 4. Edges represent target genes by the corresponding floral quartet complexes

