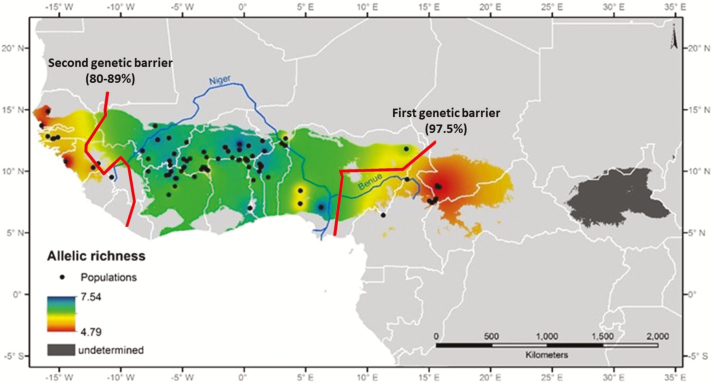
Figure 2.
IDW interpolation of allelic richness (AR) calculated for 84 Parkia biglobosa populations using 8 SSRs loci and restricted to the modeled distribution area of the species. The color gradient indicates the level of allelic richness across the species’ range. Red lines represent genetic boundaries detected by BARRIER. See online version for full colors.

