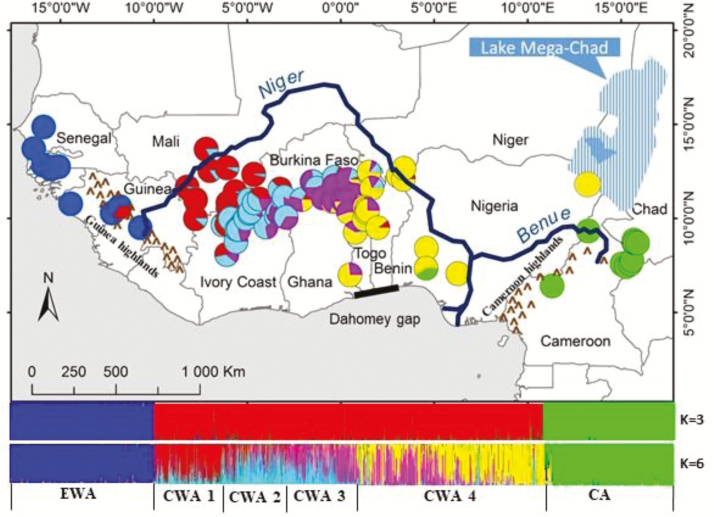
Figure 3.
Spatial distribution of genetic clusters. Colors of the pie charts refer to the 6 clusters identified by STRUCTURE (EWA, CWA 1, CWA 2, CWA 3, CWA 4, CA) and the proportion of the pie charts sectors to the relative number of individuals assigned. The histograms of individual assignments to genetics clusters are given for K = 3 and K = 6 clusters. See online version for full colors.

