
Figure 3.
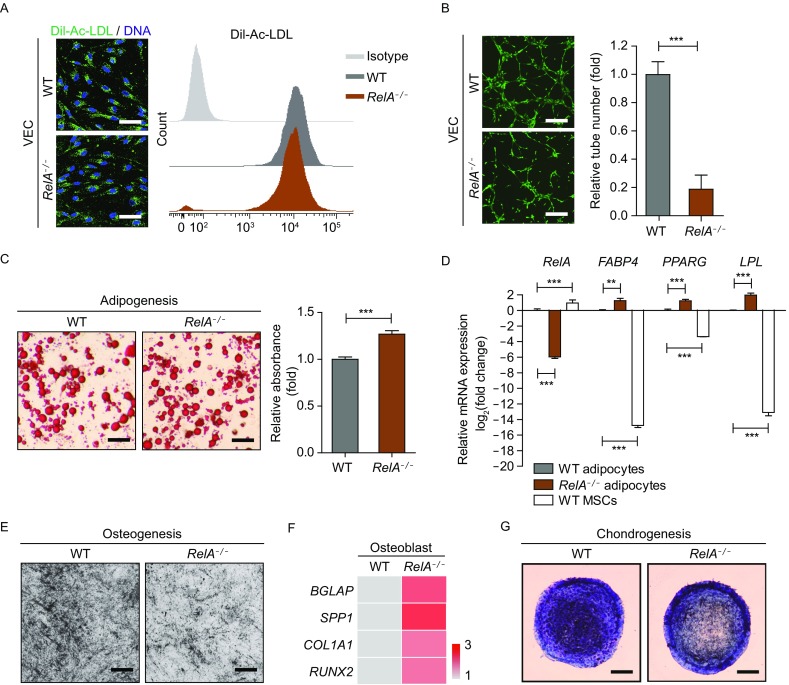
RelA deficiency affected vascular cell homeostasis. (A) Immunostaining and flow cytometry analysis of the Dil-Ac-LDL uptake capacity in WT and RelA−/− VECs. DNA was labeled by Hoechst 33342. Scale bar, 30 μm. (B) Representative micrographs of matrigel tubes formed by WT and RelA−/− VECs in vitro (n = 3). Scale bar, 3 mm. (C) Oil red O staining of WT and RelA−/− adipocytes derived from MSCs, respectively. The quantification of adipocytes was measured by absorbance at 510 nm (n = 4). *** P < 0.001. Scale bar, 3 mm. (D) Transcriptional expression of adipocyte-specific genes in WT and RelA−/− adipocytes via RT-qPCR detection (n = 4). WT MSCs were used as a negative control. 18S was used as a loading control. * P < 0.05. ** P < 0.01. *** P < 0.001. (E) Representative micrographs of WT and RelA−/− osteoblasts by Von Kossa staining. Scale bar, 3 mm. (F) Transcriptional levels of osteoblast-specific gene expression in WT and RelA−/− osteoblasts via RT-qPCR detection (n = 4). 18S was used as a loading control. (G) Representative toluidine blue staining images of WT and RelA−/− chondrocytes. Scale bar, 3 mm