
Figure 8.
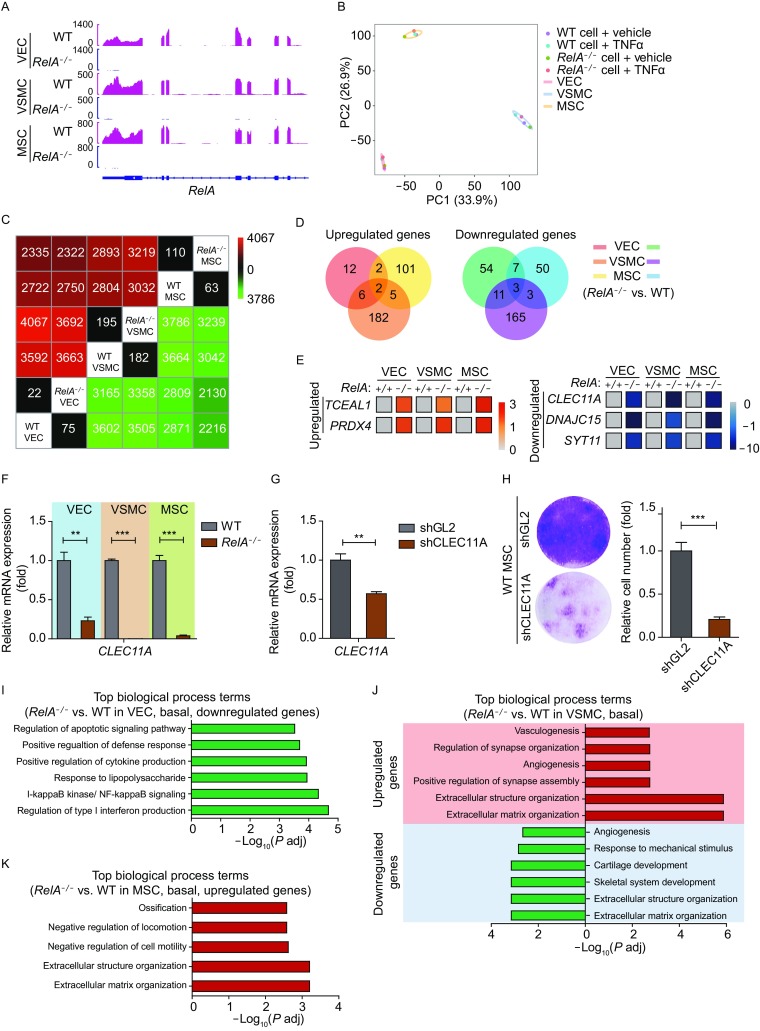
Transcriptomic analysis revealed RelA deficiency-induced vascular cell dysfunction under basal condition. (A) Transcriptional signal of RelA in WT and RelA−/− VECs, VSMCs, and MSCs. Data were normalized by RPKM (reads per kilo bases per million mapped reads) at bin size of 10 bp. (B) Principle component analysis (PCA) of various vascular cells showing a cell type-specific transcriptional pattern. (C) Heatmap showing the number of differential expressed genes between WT and RelA−/− VECs, VSMCs and MSCs under basal condition. Green color represents downregulated genes; red color represents upregulated genes. (D) Venn diagrams showing the overlap of upregulated (left) and downregulated (right) genes in RelA−/− VECs, VSMCs and MSCs compared to WT. (E) Heatmap showing the transcriptional levels of upregulated genes (RelA-/- vs. WT > 1.5, P adj < 0.05) and downregulated genes (RelA-/- vs. WT < 0.67, P adj < 0.05) in RelA−/− VECs, VSMCs and MSCs compared to WT. All FPKMs of the genes were normalized to WT groups and the relative gene expression levels are presented via Log1.5(RelA-/- / WT) in RelA-/- groups. (F) Transcriptional expression of CLEC11A in WT and RelA−/− VECs, VSMCs, and MSCs via RT-qPCR detection (n = 4). 18S was used as a loading control. *** P < 0.001. (G) Transcriptional expression of CLEC11A in WT MSCs infected with shCLEC11A lentiviruses via RT-qPCR detection (n = 4). shGL2 lentiviruses were used as a negative control; 18S was used as a loading control. ** P < 0.01. (H) Colony formation of WT MSCs infected with shCLEC11A (n = 3). *** P < 0.001. (I) GO enrichment analysis of differentially expressed genes in RelA−/− VECs compared to WT under basal condition. Enriched top GO biological process terms are presented with bars. Green bars represent downregulated genes. (J) GO enrichment analysis of differentially expressed genes in RelA−/− VSMCs compared to WT under basal condition. Red bars represent upregulated genes; green bars represent downregulated genes. (K) GO enrichment analysis of differentially expressed genes in RelA−/− MSCs compared to WT under basal condition. Red bars represent upregulated genes