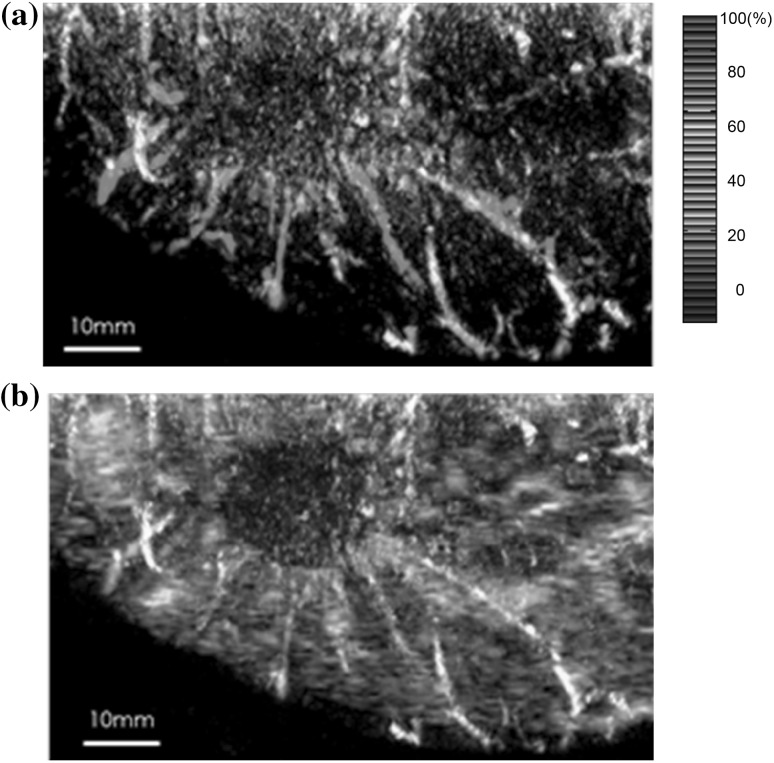
Fig. 5.
S-factor and US images of the lesion of IDC obtained using the PAM-02 system. a S-factor distribution image, displayed by color scale from blue to red as S-factor increases from 0 to 100%. b Fusion image of S-factor and US C-mode image. Many blood vessel-like signals were observed around the tumor in the US low-echo image. Furthermore, it was determined that the signals run centripetally toward the center of the tumor, and signal intensities become disrupted or weakened at the border of the tumor. (Color figure online)

