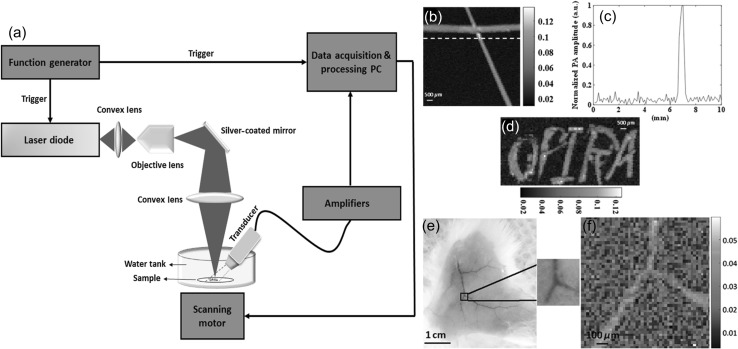
Fig. 6.
a Diagram of the reflection mode PLD-PAM system, b PAM image of a phantom made with black tape, c intensity profile along the dotted line across the PA image in b, and d PAM image of the word “OPIRA” made of black tape, Ex vivo results on mouse: e photograph of a mouse skin on which the ROI is specified, and f corresponding PAM image. Reprinted from Ref [121]

