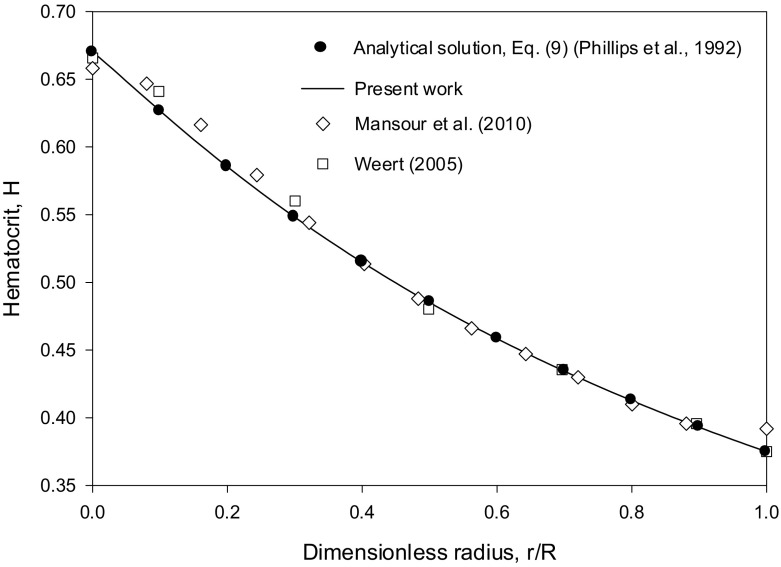
Fig. 1.
Comparison of the Runge–Kutta numerical integration results for the hematocrit profile (using Eqs. (33) and (34)), the analytical solution, Eq. (30) in [14] (generalized Eq. (35) in the present work with n = 1.82) and the numerical solutions in [16, 17] for the case HT = 0.45, using Kμ = 0.62, Kc = 0.41 (ζ = 1.512) and Hm = 0.67

