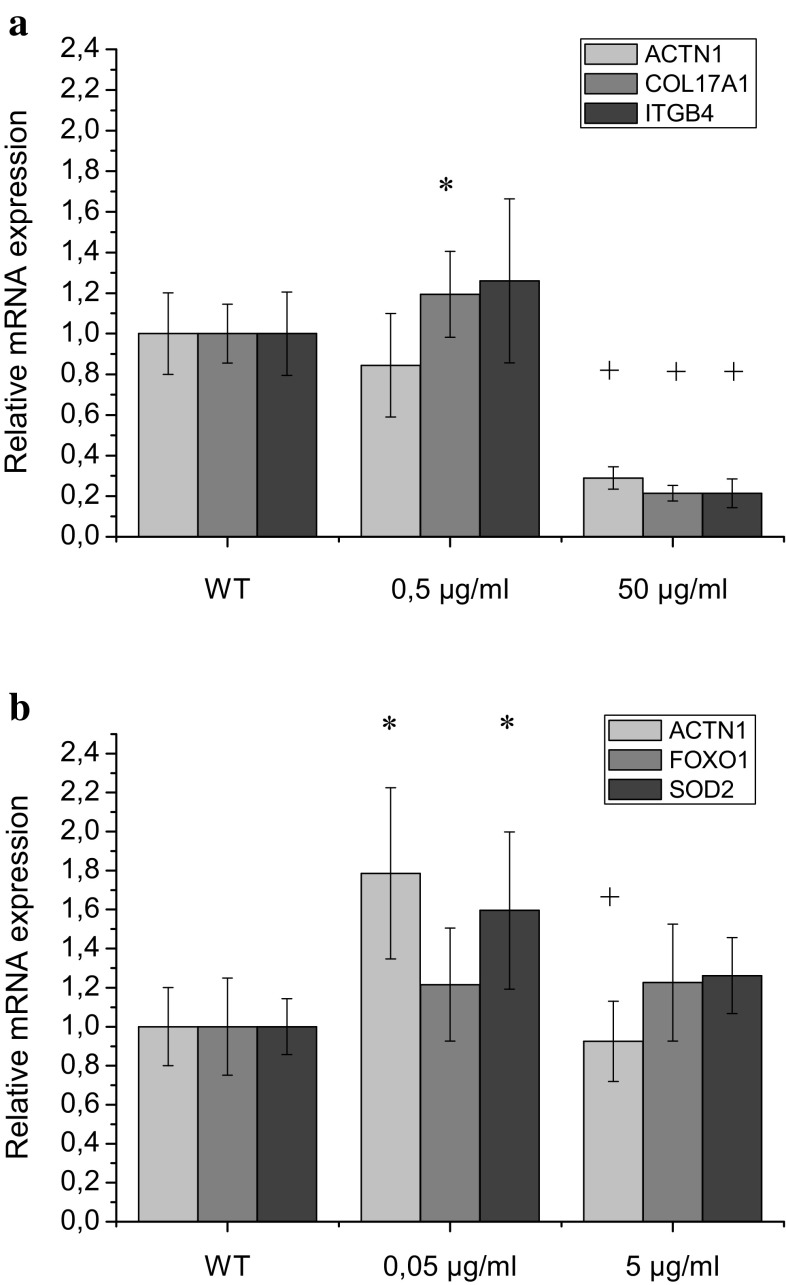
Fig. 2.
Relative mRNA expression of ACTN1, ITGB4, COL17A1, FOXO1 and SOD2 in response to P1 acetyl-tetrapeptide-20 (a) and P2 acetyl-hexapeptide-50 (b) treatment of HaCaT cells after 48 h of incubation with the peptides. ACTN1 (light gray), COL17A1/FOXO1 (gray), ITGB4/ SOD2 (dark gray). Data were normalized to mean control value (WT- cells without treatment). The results are expressed as mean values ± standard deviations. By ‘*’ we denote the cases where the gene expression was significantly different from control (p < 0.05) and by ‘+’ we denote the significant difference between the gene expression in cells treated with peptide in the lowest and the highest concentration (p < 0.05)

