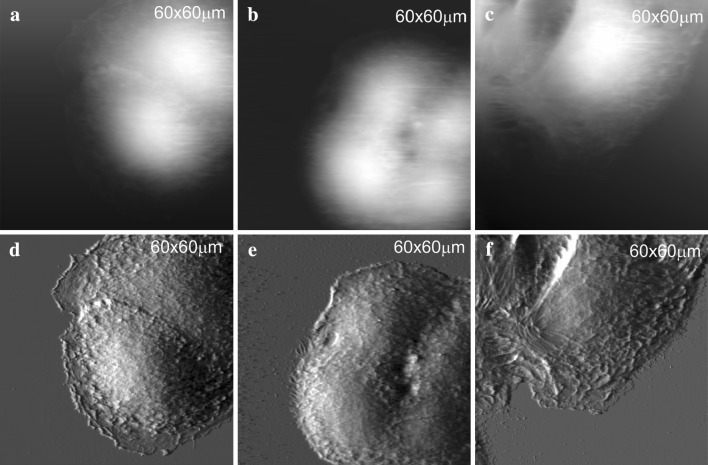
Fig. 3.
AFM images in contact mode topography of the studied HaCaT cells: height image of a typical control keratinocyte cell (a); height image of 0.5 μg/ml P1 treated cell (b); height image of 0.5 μg/ml P2 treated cell (c); deflection image of a typical control keratinocyte cell (d); deflection image of 0.5 μg/ml P1 treated cell (e); deflection image of 0.5 μg/ml P2 treated cell (f)

