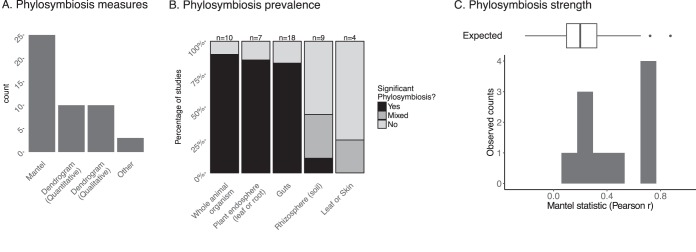
FIG 5.
Measuring phylosymbiosis in nature. (A) Summary of tests used to measure phylosymbiosis in the literature review (n = 48 studies). See Table S1 in the supplemental material for details. (B) Prevalence of significant phylosymbiosis pattern by host compartment. (C) Phylosymbiosis strength distribution across studies that used Mantel tests as measured by Pearson’s r. “Expected” is the ecological filtering expectation from simulations corresponding to 25 host species, 150 microbial units, and moderate-to-strong phylogenetic signals of the host trait (Blomberg K, {0.5, 1.5}).

