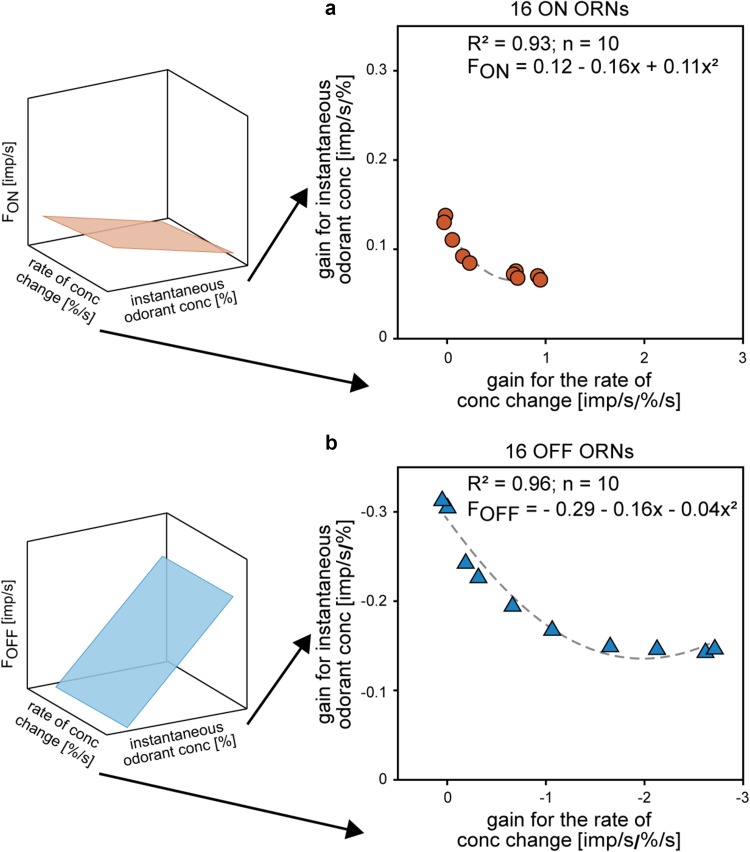
Fig. 7.
Correlation between the response gain for instantaneous concentration and the response gain for the rate of concentration change of the ON ORN (orange) and OFF ORN (blue) determined for ten oscillation periods in the range of 6–360 s. In both types of ORNs, the decrease in the gain for instantaneous concentration is related to the increase in the gain for the rate of concentration change. The negative gain values are due to the downward direction of the concentration change, resulting in an increase in impulse frequency of the OFF ORN. Mean gain values of ten ORNs are indicated and used to estimate the relations by exponential functions.
Adapted from Burgstaller and Tichy (2012)

