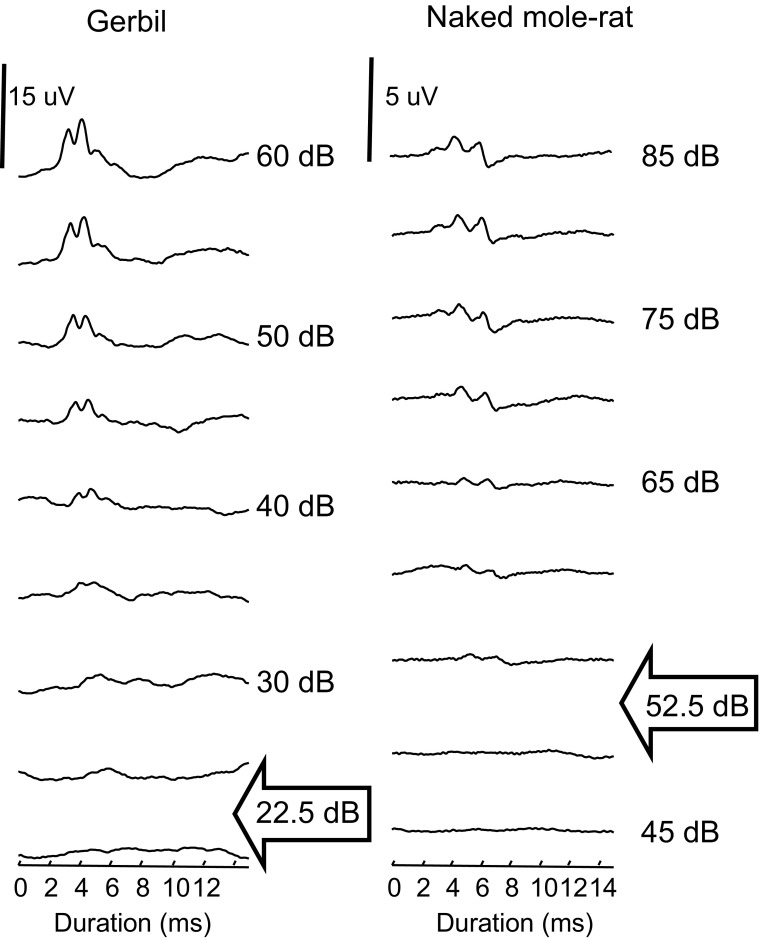
Fig. 2.
ABR waveforms evoked by a 2 kHz tone train presented at different intensities for a gerbil and a naked mole-rat. Arrows indicate thresholds for this frequency, 22.5 dB for the gerbil and 52.5 dB for the naked mole-rat. Due to the differences in thresholds, the range of intensities shown are different for the two animals. Note that the scale bars (uV) also differ between species because ABR waveform amplitudes for the naked mole-rat were smaller in general compared to the gerbil. This species difference was consistent across all animals tested

