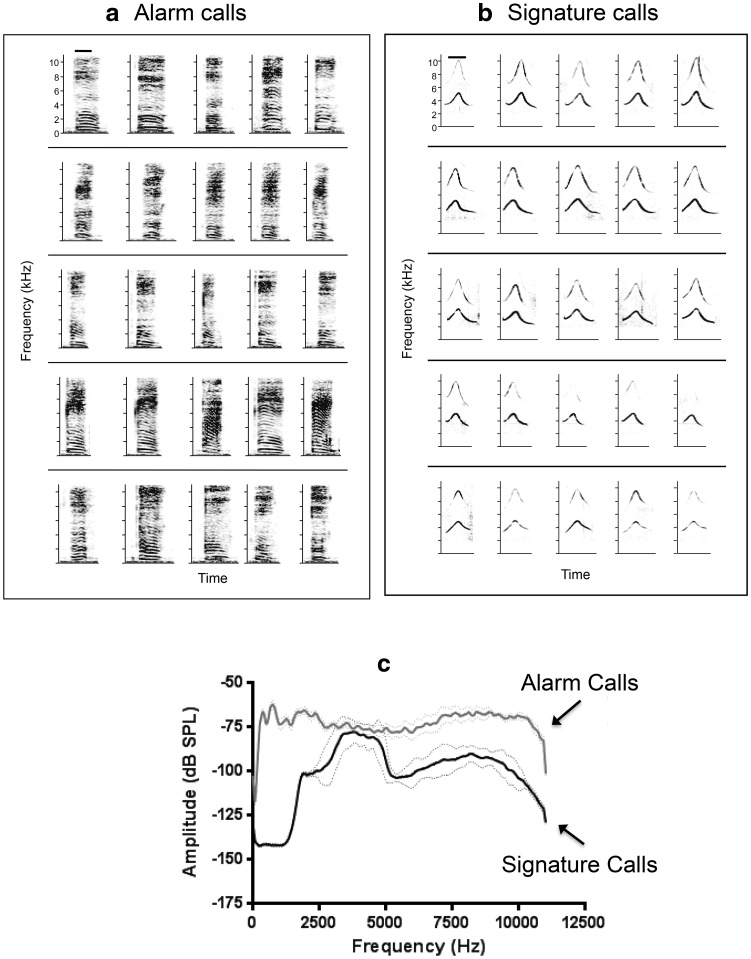
Fig. 4.
shows representative spectrograms and average power spectra from alarm calls and signature calls. a Alarm calls from five different individual naked mole-rats, five calls each (each row is from one animal). The scale bar in the upper left is 100 ms. b Signature calls from five different individual naked mole-rats, five calls each (each row is from one animal). The scale bar in the upper left is 100 ms. c Average power spectra from five animals, five calls each for alarm and signature calls

