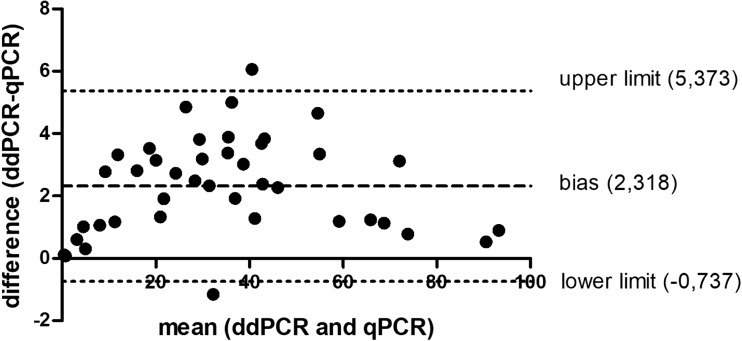
Fig. 3.
The differences between measurements by qPCR and ddPCR (y axis) vs. the mean of the sample quantification performed by qPCR and ddPCR (x axis) (the Bland-Altman plot). Dotted lines indicate bias (mean difference) and 95% limits of agreement (upper limit + 2 SD; lower limit − 2 SD) between the two given methods. A 95.12% of presented measurements fitted to the limit of agreement

